Comparing Check Point Skyline with Indeni
What is Check Point Skyline?
Check Point Skyline is a new real-time monitoring solution for Check Point devices. It uses OpenTelemetry to report telemetry data from Check Point devices. With Check Pont Skyline, you can view real-time CPView data. Check Point provides sample dashboards that you can import into your environment.
OpenTelemetry is an open-source observability framework providing a collection of tools, APIs and SDKs for capturing metrics and logs from applications. While OpenTelemetry doesn’t provide backend or analytics capabilities, it does provide several integration points for observability platforms to ingest the collected data. Check Point recommends the use of Prometheus as a time-series database and Grafana as a visualization tool.
How does it work?
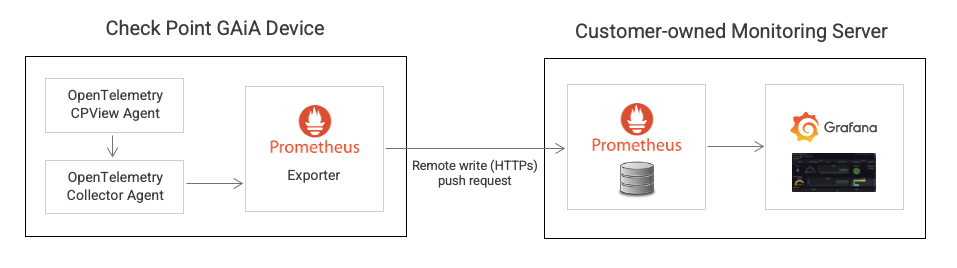
At a high level, you run the OpenTelemetry CPView Agent and the OpenTelemetry Collector Agent on GAiA devices. The OpenTelemetry Collector agent exports telemetry data to a Prometheus server. The telemetry data is stored in the Prometheus server. Using the pre-built Grafana dashboards provided by Check Point, Grafana queries Prometheus for data. Grafana allows you to see your time series data stored in Prometheus via charts and graphs.
You can learn the nuts and bolts of Skyline in sk178566. Better yet, watch the Skyline webinar. The presentation plus a live demo was only 20 minutes but the best part was the Q&A section with many great questions and answers. It’s definitely worth watching.
How does Skyline compare to Indeni?
A question was asked at the Skyline webinar. “How does Skyline compare to Indeni?”
Check Point’s answer was: “There is a very small overlap. We are focusing on providing the telemetry versus proactive monitoring.”
No doubt proactive monitoring is one of our primary use cases. Managing firewalls is more than monitoring. You need to ensure high availability readiness for seamless failover, ongoing maintenance, security risk identification, continuous compliance and best practice conformance. We have automated many of these tasks. We can even perform automated troubleshooting without human intervention to identify the root cause of the problem. We are also known to find lurking problems where other SNMP based monitoring tools cannot.
Considerations
Capturing data is critical to understanding how your firewalls are performing at any given time. It is always great to see vendors investing in new technologies to provide improved visibility. However, new technologies take time to realize their full potential. Here are a few things to consider:
- While Skyline has many metrics, it’s based on CPView data at the time of writing. Key metrics like critical processes, VPN, High Availability and routing are not available. Remember how long it took to have comprehensive SNMP coverage. The good news is that Check Point is soliciting your input so they can add the metrics that matter the most to you. For a list of supported metrics, see this document.
- Alerting is a key function of any monitoring tools. It is on Skyline’s roadmap. Meanwhile, you should not replace your monitoring solution.
- There are limitations with Skyline. For example, if you have more than 10 VSX in your environment, you cannot use Skyline. Learn more about the limitations here.
- Skyline is what I would call a DIY (Do It Yourself) model leveraging open source software. If you are comfortable with doing your own development, support, sizing and not needing any Enterprise level support, it may be an option for you when alerting is available.
Observability is critical. It is good to see Check Point increasing their focus on instrumentation to enhance visibility. If you are new to Indeni, check out our top picks for Check Point support.