Alert Simulations
Alert Simulations
Verifying that there is a rule
Assuming that you have a finished script that you wish to test you can first check if there’s an existing rule for the metric in question by searching the rules directory in the staging branch for the name of the metric. This is an example on how to search for rules associated with the metric called debug-status:

As you can see a rule exists for debug-status.
Testing a metric with an indeni script
If there is a rule you should be able to test it by staging the actual issue in the lab environment.
To do this in the example above you’d activate the debug status of a service/component on a device.
Then to manually add your script to the scripts being executed on the indeni server you can follow these simple steps:
- Run the script with the command-runner tool against the device to verify that the output is correct. Don’t forget to double check that all known metric tags are present.
- Add the script to the indeni server overwrite directory.
- Ensure that the script is picked up by the collector by restarting the Indeni collector service:
sudo service indeni-collector restart - Verify that the script is actually executed by running the following command:
tail /usr/share/indeni-collector/logs/collector.log | grep <metric name> | grep <device IP>
Manually forcing an alert
If this for some reason is not possible due to certain reasons such as the alert being based on current throughput you can manually override existing scripts to write a value that would trigger the alert.
Example:
We need to test throughput alerts in the lab environment, but adding additional throughput might be harmful to other equipment. The line of the AWK script that extracts the current transmit usage of an interface looks like this:
writeDoubleMetricWithLiveConfig("network-interface-tx-util-percentage", interfaceTags, "gauge", "60", percentageTxUsed[interface], "Network Interfaces - Throughput Transmit", "percentage", "name")
Instead, we’d modify the script to write:
writeDoubleMetricWithLiveConfig("network-interface-tx-util-percentage", interfaceTags, "gauge", "60", 90, "Network Interfaces - Throughput Transmit", "percentage", "name")
This would simulate a transmit usage of 90 percent on all interfaces of the device that the script is being executed on.
Similar changes can of course also be done to JSON and XML scripts:
_value.double:
_constant: 90
Tips
Decreasing the threshold for an alert
Sometimes it’s hard to stage an alert because of the high thresholds required to trigger it. In these cases it could be worth manually decreasing the threshold for said alert.
- Go to Operations Management -> Knowledge Management
- Search for the alert you want to modify and click on the button “Configure”
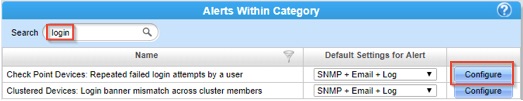
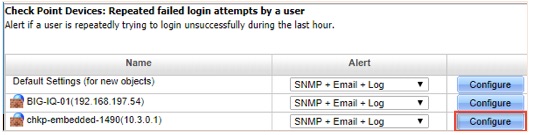
- This will open a popup window with a list of the devices added to Indeni. Click on the button called Configure for the device you want to test it on:
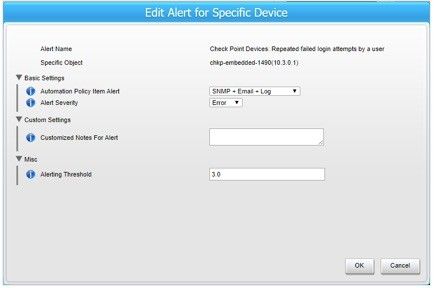
- In this dialogue you can manually decrease the threshold for a specific device while testing the script.
Make it run more often
If you are impatient like me it could be worth decreasing the interval to 1 minute for the script that you want to test. This might make the alerts come faster. Note however, that if you do this with scripts that has a limit, and a usage you must make sure to synchronize the interval for both scripts.
Example:
I want to test routes-usage on one of my scripts so I decrease the interval to 1 minute. After that I would also have to locate the script which extracts routes-limit and decrease the interval on
Samples
Check out the Cisco Nexus Acceptance Test Plan. It has many examples of how you can test the scripts by simulating alerts.