Building Powerful Grafana Dashboards
By using Indeni, security infrastructure teams have access to many metrics. Between Check Point and Palo Alto Networks firewalls, Indeni collects over 500 unique metrics. While the Indeni WebUI provides dashboards and custom reporting capabilities, enterprises are often relying on third party tools for even more compelling diagrams and customized dashboards. They want to bring together unique data sources from many vendors and different device types. One such tool is the very popular open source Grafana.
This post is intended for a technical audience who is planning to develop custom dashboards from scratch. Knowledge of Grafana and JSON is assumed. The post takes you from the initial integration with Grafana to understanding details about the Indeni metrics and the structure of the data. It will cover tools you can use to discover the metrics, how to interpret them and correctly parse them while building out powerful dashboards. This post will not cover the Grafana installation as there are a lot of great resources out there. Configuring Grafana to query the Indeni platform is straightforward and it is covered in our documentation.
Indeni integration with Grafana
There are two types of integration.
1. Indeni Plugin for Grafana
Grafana-Indeni is a plugin for Grafana allowing users to visualize a subset of the data collected by the Indeni platform. The plugin is intended to make plotting your data easy using a number of graphs and reports. There is no need to understand the structure of the data and no parsing is required. You can find more information about the plugin here.
2. JSON API
The JSON API plugin is a popular open source data source plugin for loading JSON APIs into Grafana using JSONata. It executes requests against Indeni’s in-memory database and parses JSON responses into Grafana dataframes. It provides the flexibility a programmer expects. Indeni’s in-memory database consists of data collected from all the devices in the last 90 minutes. Effectively, this has a lot more data points than the Indeni plugin for Grafana. We used the JSON API plugin to build out compelling dashboards. With the JSON API plugin, you need to understand how the data is structured and have knowledge on query languages such as JSONata. Although it is more complex than the Indeni plugin, it is more powerful and flexible.
Introducing iktool (Indeni Knowledge Tool)
Indeni Knowledge tool (iktool) is a powerful CLI tool we use to develop Auto-Detect elements. It provides a lot of useful information about the devices Indeni is managing, device unique identifiers and the metrics collected for the device. Open the SSH terminal on your indeni server and run the iktool command.
indeni@indeni-server:~$ iktool
Usage: iktool [-h] <options> [parameters]

op
    devices_show_all
    device_info_show            <device_id>
    alert_delete_all            <device_id>
    alert_delete_single         <alert_id>
    metric_get                  <metric_name> <device_id>
    metric_show_all             <device_id>
    overwrite_file_create       <path_to_stable_ind_file>
    overwrite_files_show
    overwrite_file_delete       <all|<specific_ind_file>
    knowledge_version_show
    catalog                     <vendor> <metric>

workflow
    real_device_workflow        <config_file>
    real_device_block           <config_file>
    mock_data_workflow          <config_file>
    mock_data_block             <config_file>

snapshot
    create
          json
              ind_per_device    <target_file_name> <devices.txt>
    compare
          json                  <old_json_file> <new_json_file>

logs
    devices
          backup
    show
          device                <device_id>
    show                        <collector.log|indeni.log|backup.log>

--help, -h
--version

indeni@indeni-server:~$
We will show you how to use the tool to retrieve the available metrics for a device and see the data structure. Before we do that, let us introduce you to the Indeni metrics.
Understanding the Indeni metrics
Indeni Time Series Data
Indeni collects data at different points in time. Depending on the metric, the collection interval varies from one minute to one hour. Plotting time series data on a graph makes it much easier to digest the data and tracks changes over time.
Most metrics collected by Indeni are numeric in form and are called double metrics. They are a number with a decimal point, such as 0.0, 1.0, 123.45, etc. A lot of the metrics are boolean representing true or false, up or down state, enabled or disabled. We use double metrics to represent a current state. The value of 1.0 means true, up or enabled. Some of the metrics are measurements such as number of packets. Some metrics are percentages such as CPU usage.
We also have complex metrics that are not numeric, e.g. serial number, a list of files. These metrics are used to check the current configuration of a device. A complex metric can be a simple string and it is stored in a JSON format.
{“value”:”America/San_Francisco”}
A complex metric can also be a list of items, stored in a JSON array, e.g. a list of core dump files.
[{“path”: “/somepath1”, “created”: “14502281”}, {“path”: “/somepath2”, “created”: “14502351”}]
Now that you have some idea of what the metrics look like, let’s take a look at a simple example.
What does the data look like?
First, let’s pick a device by retrieving the list of device identifiers using iktool. The queries we’ll be using require the device’s unique identifier.
indeni@indeni-server:~$ iktool op 'devices_show_all'
Device info for all devices
id                                    ip_address       name
------------------------------------  ---------------  ---------------------
22e63ff5-2dc4-472c-be4f-195b010f3ecb  10.11.94.142     CP-R81-VSX1-1
78c11d23-f90e-4a8c-b247-fb1f6f03241f  10.11.95.5       PAN-FW1-10.0
8815612b-c984-4a63-88c2-ef70450e7f4e  10.11.94.134     CP-R81-MGMT-1
5b8f2e69-cddb-4580-ae28-247073bb391e  172.16.20.81     panos
8b934d98-c1a5-46f4-bd21-aebe743031b0  10.11.93.71      FortiGate-V7_0_5-FW01
8b7bdc17-94a3-42d5-b957-beac8acaf35e  10.11.94.132     CP-R81-VRRP-1
6ef0290e-1273-41bd-89cb-ead8ec0ff828  10.11.94.131     CP-R81-GW2
b582b403-beca-4ba3-9bab-f247c1d57cd7  10.11.94.133     CP-R81-VRRP-2
964a252d-d6c6-4319-9d73-0804645bffe3  10.11.94.137     CP-R81-MDS-2
28785bcf-dac9-4f8e-81c8-529ad1fae2b9  10.11.94.108     CP-R80.20SP-VSX
2095d544-809e-445d-aa2e-1a31d8510282  10.11.89.22      Arbor-AED-6.7.0.0
31a68a41-734a-4b90-abfc-0d766687cfe6  10.11.80.1       CP-R80.40-GW1-1
724d8cff-ad4f-4fc5-aa4a-76157d979343  10.11.94.136     CP-R81-MDS-1
ce360d5b-9918-424d-832f-e2381b842243  10.11.94.150     CP-R81.10-GW1
2a7a25b6-b971-47e0-bb54-ee6768dc51dd  10.11.95.12      PAN-Panorama02-10.0
c9ce94a2-57e3-42f8-a154-beb75f64ad25  10.11.95.11      PAN-Panorama01-10.0
cc2916e3-28da-453a-a25c-7e429f33a8e4  10.11.95.6       PAN-FW2-10.0
d29a1e94-6104-4204-b773-752b2096f20f  10.11.80.41      RedHat7
edd8de4b-82e5-47d6-8ff9-beea5f8f0483  10.11.94.135     CP-R81-MGMT-2
52837394-b6e7-4a4a-ad54-a814f5b6b6d9  10.11.80.11      CP-R80.40-VSX1-1
b104f20b-908b-4d85-859a-0fde1bf393c9  10.11.93.72      FortiGate-V7_0_5-FW02
46f2bf23-1be4-4c74-8bdd-605cc53e4adc  10.11.80.2       CP-R80.40-GW1-2
09317a32-6b5e-4692-ad5f-73fd190be7fa  10.10.10.131     UbuntuIndeniShouky
d96360f1-7d40-4c9f-bc42-8ea8cef27ee3  10.11.80.40      RedHat
b305d370-c48a-4404-a9ff-89cb3b3cfac6  10.11.94.143     CP-R81-VSX-1-2
245312f1-5557-4e8d-8dbc-ee7f09d9228d  10.11.94.144     CP-R81-MLM
8db53fec-4386-4bac-9d93-d0b296ebeb34  10.11.88.1       IL-Fortinet-VPN
961f3eeb-8dc3-4709-9a9a-1727a8c41ffc  10.11.93.62      FortiGate-V6_4_8-FW02
80fed3ad-1d8b-4a8c-9975-64f3bfe9c264  10.11.80.52      Maestro Orchestrator
dd6f15f4-b9b0-40d8-81dd-4f5a41668ab0  10.11.94.130     CP-R81-GW1
ba1ff0ce-6d3a-4c6e-8f6d-37e98f7a37c5  192.168.193.223  ASA1
410881c5-533d-43ff-8395-b7bd822bdc7c  172.17.0.1       indeni Server
ab8df5f1-e44d-4082-9cea-244474d0fa0c  192.168.193.224  ASA2
Let’s look at a simple complex metric example. Say we want to find out the device vendor. Let’s pick PAN-FW1-10.0, a Palo Alto Networks firewall. Grab the device-id. Select the metric vendor.
indeni@indeni-server:~$ iktool op "metric_get" vendor 78c11d23-f90e-4a8c-b247-fb1f6f03241f
[{'ind_name': 'panos-show-system-info-monitoring',
  'metric_type': 'complex_metric',
  'points': [{'fs-ts': 1649194598519,
              'jsval': {'value': 'Palo Alto Networks'},
              'ts': 1649347199421},
             None,
             None],
  'start': 1649342003441,
  'step': -1,
  'tags': {'device-id': '78c11d23-f90e-4a8c-b247-fb1f6f03241f',
           'display-name': 'Vendor',
           'im.name': 'vendor',
           'im.step': '300',
           'ind.name': 'panos-show-system-info-monitoring',
           'live-config': 'true'}}]
indeni@indeni-server:~$
The response to the command is in a JSON array format. The metric vendor is a complex metric since it is not a number. The 3rd item in the array, “points”, is a JSON array itself. As expected, you can see the value “Palo Alto Networks”. Later on, we will see how we can extract just the vendor from the JSON document.
Let’s look at a double metric example, say a metric showing states. Using the same device, let’s select the metric bgp-state.
indeni@indeni-server:~$ iktool op "metric_get" bgp-state 78c11d23-f90e-4a8c-b247-fb1f6f03241f
[{'ind_name': 'panos-show-protocol-bgp-peer',
  'metric_type': 'double_metric',
  'points': [None,
             None,
             1.0,
             1.0,
             1.0,
             1.0,
             1.0,
             1.0,
             1.0,
             1.0,
             1.0,
             1.0,
             1.0,
             1.0,
             1.0,
             1.0,
             1.0,
             1.0,
             1.0,
             1.0,
             1.0,
             1.0,
             1.0,
             1.0,
             1.0,
             1.0,
             1.0,
             1.0,
             1.0,
             1.0,
             1.0,
             1.0,
             1.0,
             1.0,
             1.0,
             1.0,
             1.0,
             1.0,
             1.0,
             1.0,
             1.0,
             1.0,
             1.0,
             1.0,
             1.0,
             1.0,
             1.0,
             1.0,
             1.0,
             1.0,
             1.0,
             1.0,
             1.0,
             1.0,
             1.0,
             1.0,
             1.0,
             1.0,
             1.0,
             1.0,
             1.0,
             1.0,
             1.0,
             1.0,
             1.0,
             None,
             1.0,
             1.0,
             1.0,
             1.0,
             1.0,
             1.0,
             1.0,
             1.0,
             1.0,
             1.0,
             1.0,
             1.0,
             1.0,
             1.0,
             1.0,
             1.0,
             1.0,
             1.0,
             1.0,
             1.0,
             1.0,
             1.0,
             1.0,
             1.0,
             1.0],
  'start': 1649261280000,
  'step': 60000,
  'tags': {'device-id': '78c11d23-f90e-4a8c-b247-fb1f6f03241f',
           'display-name': 'BGP Peers - State',
           'im.dstype': 'gauge',
           'im.dstype.displaytype': 'boolean',
           'im.identity-tags': 'name',
           'im.name': 'bgp-state',
           'im.step': '60',
           'ind.name': 'panos-show-protocol-bgp-peer',
           'live-config': 'true',
           'name': 'BGP Group: PAN_10_BGP_peer_1 Peer Name: PAN_10_peer_bgp_1 '
                   'Peer Address: 10.0.102.3'}}]
indeni@indeni-server:~$
indeni@indeni-server:~$
You can see the metric name “bgp-state”. The 3rd item in the array, “points”, is a JSON array itself. It consists of actual bgp states measured at a 1 minute interval, starting at time “1649261280000” in epoch format. The BGP state “1.0” means bgp is up in the last 90 minutes. The last item “name” is the name of the BGP peer that is helpful to include in the display.
Building Grafana Queries
Now that you know what the data looks like, you can build a Grafana query using the query editor to fetch the information you want to display in Grafana. Let’s look at a simple one first. In this case, we want to grab just the vendor name from the query response.
The Grafana query request:
GET /metrics?query=(device-id==’$device_id’;im.name==’vendor’)&start=$__from
From the Path tab of the query editor:

You use a query language such as JSONata to extract the vendor name from the JSON query response.
The query expression to extract the value “Palo Alto Networks”:
*.points[0].jsval.value.$string()
The Fields tab is where you specify the query expression.

Let’s look at a more interesting example, the bgp-state metric. In this case, you want to extract several values in a time series data format to draw a graph. Again, you use JSONata to extract the states, the corresponding timestamps and the BGP peer name from the JSON response.
The grafana query:
GET /metrics?query=(device-id==’$device_id’;im.name==’bgp-state’)&start=$__from
From the Path tab of the query editor:

Specify the query expression in the Fields tab.

The query expression for BGP states:
$map($, function($v, $i, $a){$map([$v].points, function($vv, $ii, $aa) {{“point”:[$v].points[$ii],”timestamp”:[$v].($number(start)+(($number($ii)*$number(step)))),”tag”:[$v].tags.name}})}).point
The query expression for timestamps:
$map($, function($v, $i, $a){$map([$v].points, function($vv, $ii, $aa) {{“point”:[$v].points[$ii],”timestamp”:[$v].($number(start)+(($number($ii)*$number(step)))),”tag”:[$v].tags.name}})}).timestamp
The query expression for the BGP peer:
$map($, function($v, $i, $a){$map([$v].points, function($vv, $ii, $aa) {{“point”:[$v].points[$ii],”timestamp”:[$v].($number(start)+(($number($ii)*$number(step)))),”tag”:[$v].tags.name}})}).tag
You can see the result of the query expression by enabling Table view from the query editor.

You can see the data is correctly extracted and populated in the form of a Grafana dataframe.
Getting Started
While it’s easy to get started with Grafana and there are plenty of resources out there to help you, it can be challenging if you have to build the dashboard from scratch. It is certainly very time consuming. That’s why we did all the heavy lifting by building curated dashboards for you. Check out our Grafana-indeni dashboard repository in Bitbucket. You will find the JSON files of these dashboards containing everything you need such as layout, variables, styles, data sources, queries, query expressions to extract the data, etc.
Once you import these JSON files into your Grafana environment, you can easily customize the dashboards to meet your needs. It is also easy to build your own query now that you’ve samples of all the queries and query expressions. We’ve plans to add a lot more dashboards going forward so remember to check back from time to time for new panels and dashboards.
Tips & Tools
1. Retrieving a list of full metrics from Indeni
Using iktool, you can retrieve a full list of metrics of a device. Let’s get the list from a Check Point GAiA device.
indeni@indeni-server:~$ iktool op 'metric_show_all' 31a68a41-734a-4b90-abfc-0d766687cfe6
arp-limit
arp-table
arp-total-entries
bgp-active-routes-counter
bgp-hidden-routes-counter
bgp-state
ca-accessible
chkp-allowed-host-any
chkp-auditlog-enabled
chkp-max-login-failed-attempts
chkp-mgmtauditlogs-enabled
chkp-os-bit
chkp-os-build
chkp-os-kernel
chkp-password-complexity
chkp-systemlog-enabled
cluster-member-active
cluster-member-active-live-config
cluster-member-states
cluster-mode
cluster-preemption-enabled
cluster-state
cluster-state-live-config
cluster-vip
clusterxl-ccp-mode
clusterxl-pnote-state
concurrent-connections
concurrent-connections-limit
concurrent-connections-limit-snapshot
concurrent-connections-usage
config-unsaved
configuration-content
connected-networks-table
core-dumps
coredumping-enabled
cores-locked
cphaprob-required-interfaces
cphaprob-required-secured-interfaces
cphaprob-up-interfaces
cphaprob-up-secured-interfaces
cpu-usage
current-datetime
debug-status
destination-cache-limit
destination-cache-usage
disk-total-kbytes
disk-usage-percentage
disk-used-kbytes
dns-response-time
dns-server-state
dns-servers
domain
failed-logins
fast-accel-status
fast-accel-table-entries
fast-accel-table-status
features-enabled
file-modifed-last-day
hostname
hostname-exists-etc-hosts
hotfix-jumbo-take
hotfixes
inode-total-count
inode-used-count
interface-hw
ipassignment-conf-errors
kernel-table-actual
kernel-table-limit
license-expiration
licenses
lines-config-files
listening-ports
load-average-fifteen-minutes
load-average-fifteen-minutes-live-config
load-average-five-minutes
load-average-five-minutes-live-config
load-average-one-minute
load-average-one-minute-live-config
local-logging-status-live-config
log-kernel-connection-refused
log-server-communicating
logged-in-users
login-banner
memory-free-kbytes
memory-total-kbytes
memory-usage
min-passwd-length
model
network-interface-admin-state
network-interface-admin-state-logical
network-interface-duplex
network-interface-ipv4-address
network-interface-ipv4-subnet
network-interface-mac
network-interface-mtu
network-interface-rx-bits
network-interface-rx-dropped
network-interface-rx-dropped-percentage
network-interface-rx-error-percentage
network-interface-rx-errors
network-interface-rx-frame
network-interface-rx-overruns
network-interface-rx-packets
network-interface-rx-util-percentage
network-interface-speed
network-interface-state
network-interface-state-logical
network-interface-tx-bits
network-interface-tx-carrier
network-interface-tx-dropped
network-interface-tx-dropped-percentage
network-interface-tx-error-percentage
network-interface-tx-errors
network-interface-tx-overruns
network-interface-tx-packets
network-interface-tx-util-percentage
network-interface-type
network-interfaces
not-logging-locally
ntp-servers
os-name
os-version
pbr-rules
policy-install-last-modified
policy-installed
policy-name
process-cpu
process-memory
process-state
process_state_snmpd_state
process_state_syslogd_state
radius-servers
routes-missing-kernel
securexl-accept-template-status
securexl-drop-template-status
securexl-nat-template-status
securexl-status
serial-numbers
snmp-communities
snmp-contact
snmp-enabled
snmp-location
snmp-traps-receiver
snmp-traps-status
snmp-users
snmp-version
software-eos-date
ssh-timeout
ssh-version-1-enabled
static-arp
static-routing-table
syslog-servers
tacacs-enabled
tacacs-servers
tasks-zombies
telnet-enabled
timezone
unencrypted-snmp-configured
uptime-milliseconds
user-id
users
vendor
vmalloc-total-kbytes
vmalloc-used-kbytes
vpn-tunnel-state
indeni@indeni-server:~$
2. Query Inspector
Throughout development, one of the built-in tools we used frequently to troubleshoot issues is Query Inspector. This is helpful if your graph doesn’t show any data or the result isn’t what you expected. You can see the error response from the query.
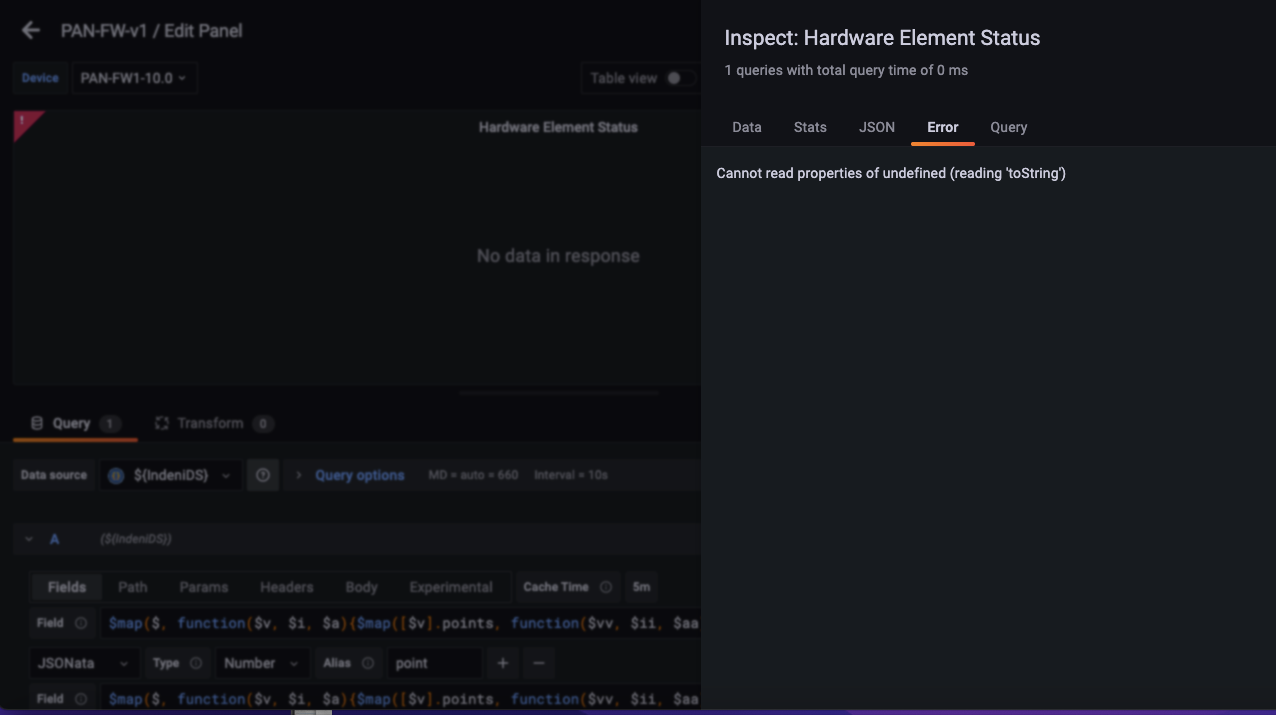

Here, you can see if the data is correctly extracted and interpreted for display. The actual value of the state is 1.0, but instead you want to translate the value 1.0 to “Up”.
3. Exploring the Indeni API
To explore the Indeni API using CLI or tools such as Postman, use this API URL Path.

See below an example of making a GET request from Postman:


4. Useful Resources
JSONata resources:
- Documentation: https://docs.jsonata.org/simple
- Online parser: https://try.jsonata.org/
JSONPath resources:
- Documentation: https://docs.mashery.com/connectorsguide/GUID-751D8687-F803-460A-BC76-67A37779BE7A.html
- Online parser: https://jsonpath.com/
Conclusion
There is a lot of data you can extract from the Indeni server. With Grafana, you can now visualize literally millions of data points. Humans respond to and process visual data better than any other type of data. Since we are visual by nature, we plan to invest more on Grafana so you can process the data more effectively.
Go ahead and experiment with the dashboards. Enjoy!