Grafana Dashboards for Check Point & Palo Alto Networks Firewalls with Indeni 7.10
Curated Grafana Dashboards
A critical part of managing security infrastructure is to collect telemetry data from firewalls, gaining deep visibility into network performance and health. Between Check Point and Palo Alto Networks firewalls, Indeni collects over 500 unique metrics. This is clearly a lot of data to digest and discerning usable information from them can be difficult. Humans understand visual information much faster than any other form of information, using data visualization to make sense of all that data is a no-brainer.
Grafana is a multi-platform open source analytics and interactive visualization web application. It provides charts, graphs and alerts for the web when connected to the Indeni platform using Indeni’s API. Integrating Indeni with Grafana allows you to explore all the telemetry data, uncover insights to provide you with unprecedented visibility.
We are very excited to announce the availability of sample dashboards for Check Point and Palo Alto Networks firewalls. There is no coding involved. You don’t even need to know Grafana. All that is required is to stand up a Grafana server, connect it with the Indeni platform using Indeni’s API, and import the JSON files for the dashboards. It is that simple! Follow the configuration guide here.
Check Point Secure Gateway Dashboard
The curated dashboard is organized by functions. It uses rows as logical dividers within a dashboard to group panels together.
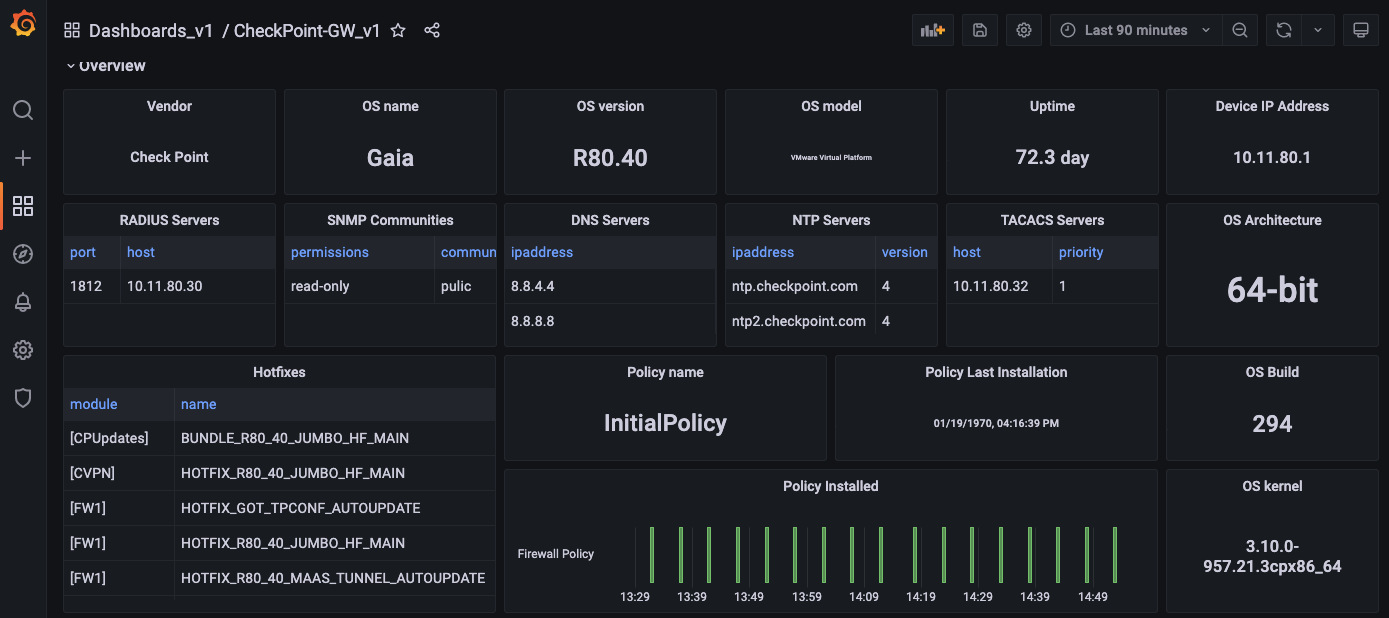
1. Overview
The overview provides an at-a-glance view about the firewall.
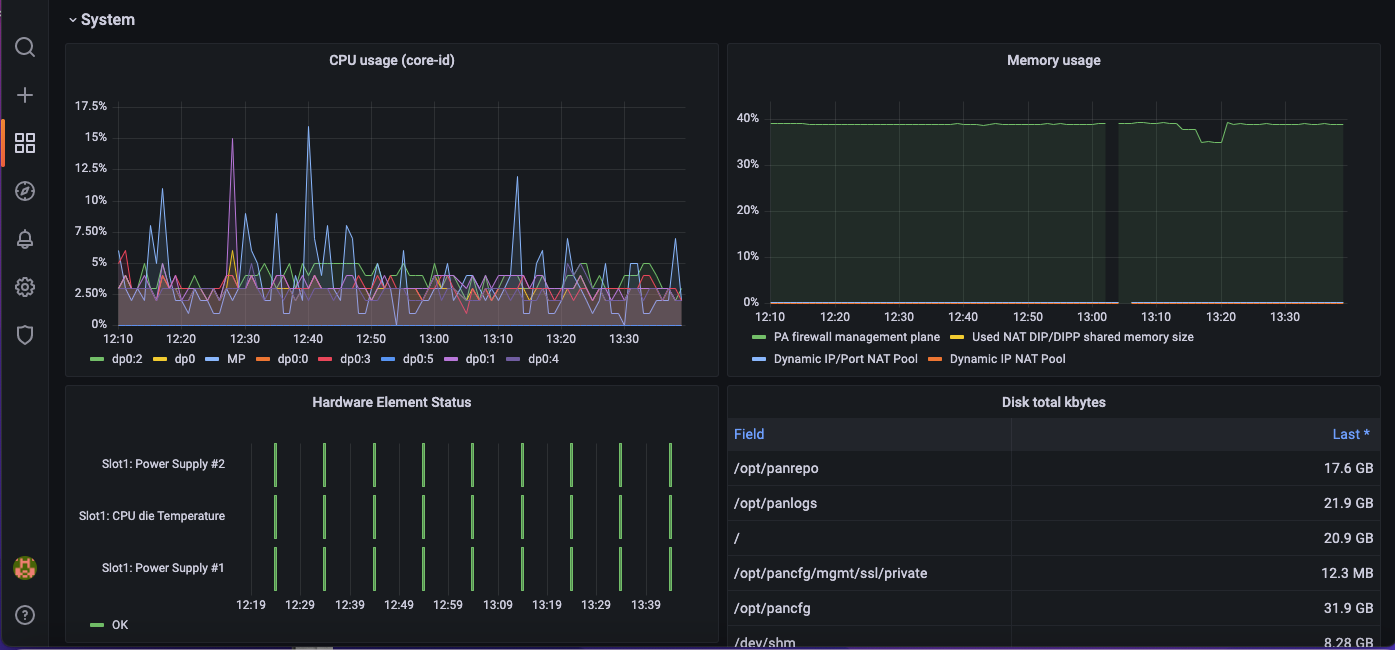
2. System
The System section provides information about the system resources such as CPU usage, memory and disk usage.

3. Network
Indeni collects a wealth of information about network statistics so you can expect a lot of panels in the network section. The information includes everything about the interfaces; their admin state, actual state, speed, bandwidth utilization as well as configuration information such as IP addresses. It also includes information about connection counts, number of NAT connections and ARP entries.


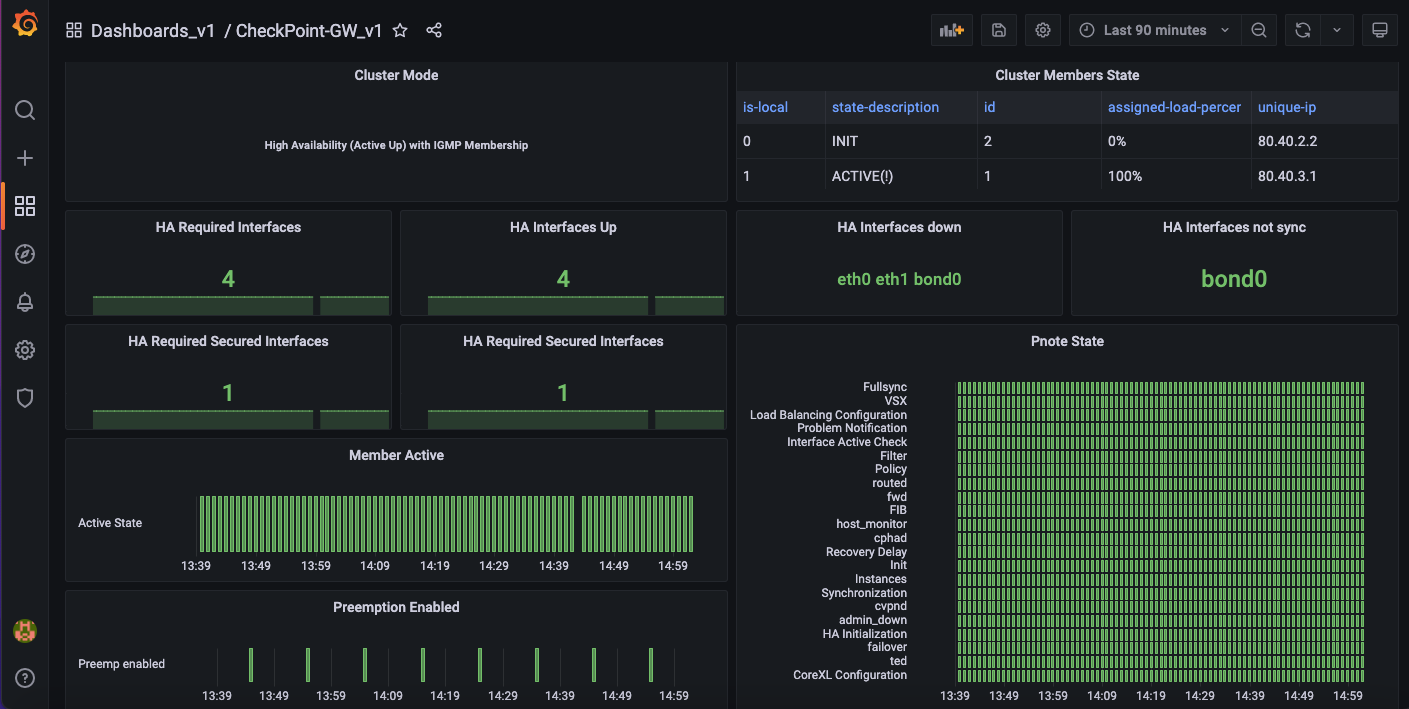
4. High Availability
The High Availability section provides useful information about the device state within a cluster. It shows information about the required interfaces and problem notification (pnote) states.
5. Routing
The routing section includes information about static routes, OSPF, BGP and route cache.

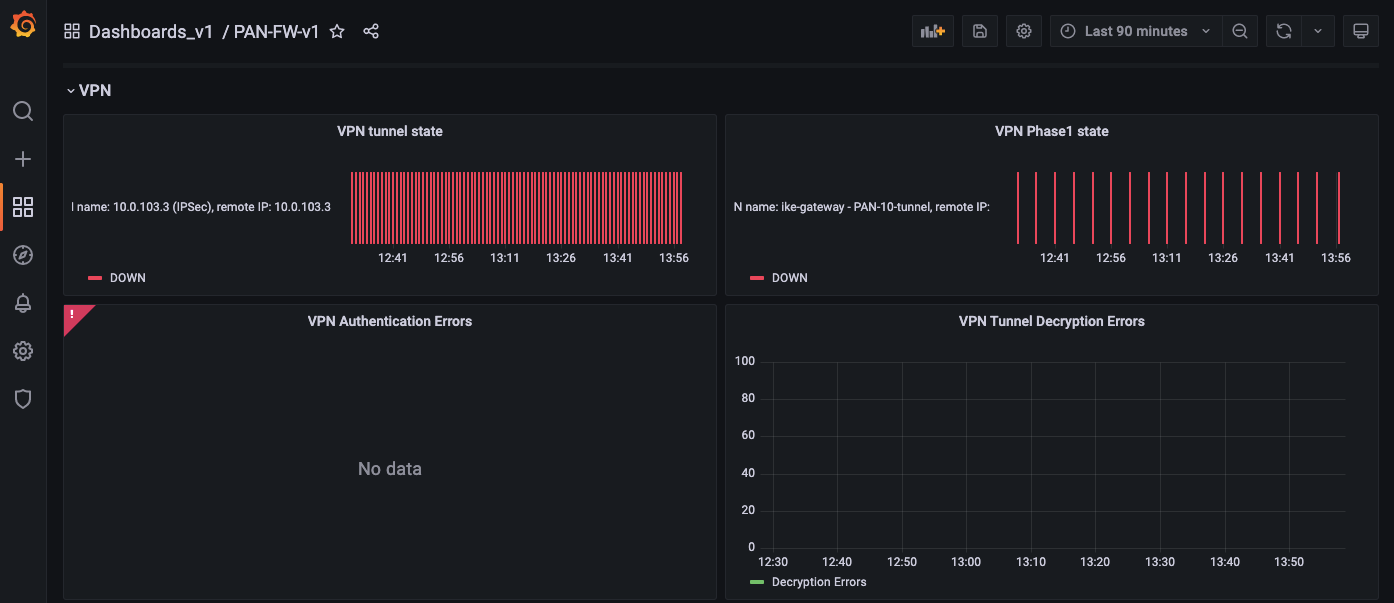
6. VPN
This includes permanent and non-permanent tunnels.

7. Services
This section includes logging and DNS information.

8. Vendor Specific
The vendor specific section consists of information about core dumps, kernel and SecureXL.


9. Manageability
This section provides configuration information about SNMP.
Note: The dashboard is for Check Point gateways. We will soon be releasing dashboards for VSX and MDS.
Palo Alto Networks Firewall Dashboard
1. Overview
Similar to Check Point firewalls, the dashboard is organized by functions unique to Palo Alto Networks firewalls. The overview provides an at-a-glance view about the firewall.

2. System
This System section provides information about the system resources such as CPU usage, memory and disk usage. It also includes information about the current state of the hardware.
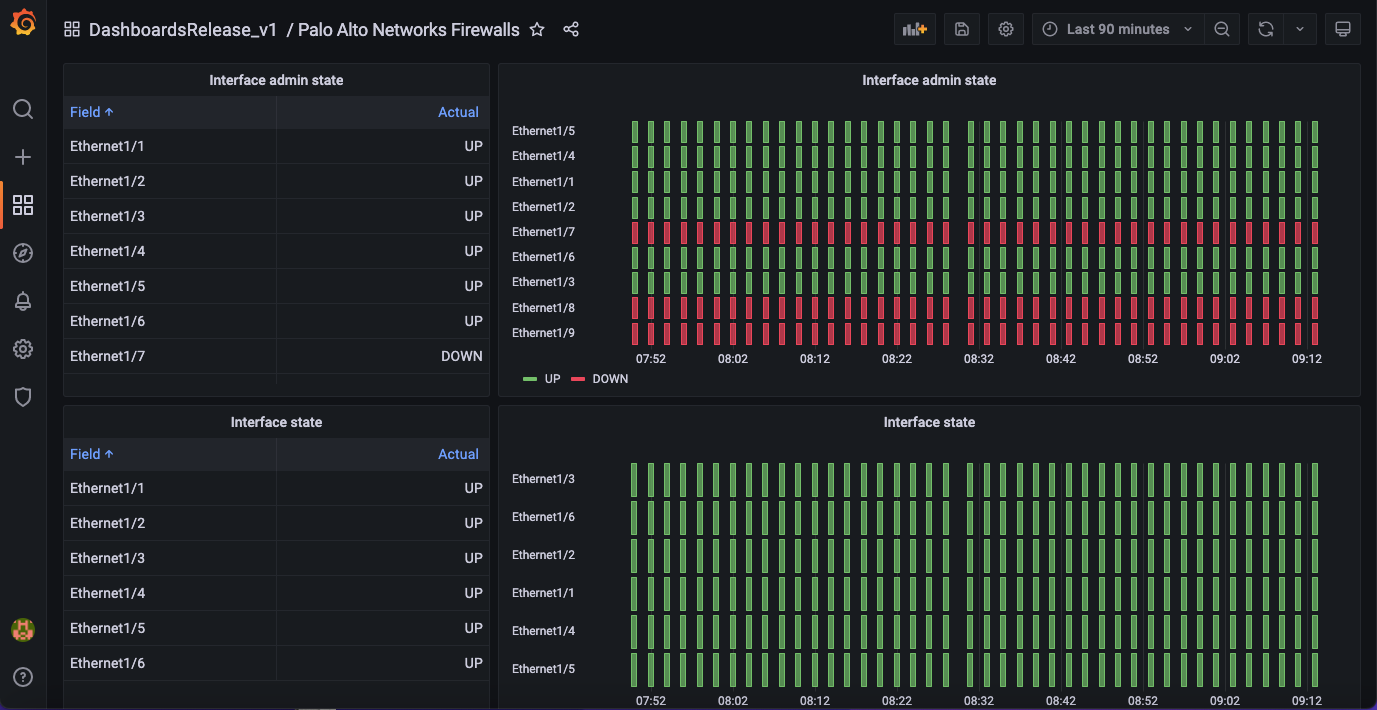
3. Network
Indeni collects a wealth of information about network statistics so you can expect a lot of panels in the network section. The information includes everything about the interfaces; their admin state, actual state, speed, bandwidth utilization and error information. It also includes information about connection counts, connection rate, MAC entries and ARP entries.

4. High Availability
The High Availability section provides useful information about the device state within a cluster.

5. Routing
The routing section includes information about route usage, static routes and BGP.

6. VPN
This includes VPN phase1 state, tunnel state, authentication errors and VPN Tunnel decryption errors.
7. SSL Decryption
This section includes the current SSL decryption count along with the limit, SSL decryption memory usage and decryption error counts.

8. Services
This section includes state information about logging, LDAP & NTP servers.

9. Vendor Specific
The vendor specific section consists of information about core dumps, EDL, Antivirus update, content update, URL filtering cloud and Wildfire.

Note: The dashboard is for Palo Alto Networks firewalls. We will soon be releasing a dashboard for Panorama.
Other Platform Enhancements
1. Removal of Log4j
Although Indeni is not impacted by Log4Shell, a zero-day vulnerability in Log4j, we are highly committed to security. We have completely removed the use of Log4j to ensure that our product is secure.
2. Un-select all items for Custom Reports
Some of the graphs can have a very large number of items and it is necessary to click on all of the items that we want to remove from the graph. We added the “un-select” all items to allow you to select the few items that you want displayed.
What’s New with Check Point Device Automation?
1. New Check Point Releases – R81SP & R81.10SP
Support for Check Point Maestro and Scalable Platforms now extends from earlier versions of GAiA to the latest release Check Point GAiA R81SP and R81.10SP.
2. New Auto-Detect Elements for Secure Gateways
- Alert if the device fails to update the threat prevention policy within the defined threshold.
- Compare Connection limits between cluster members, alert if mismatch detected.
- Support for SecureXL Fast Accelerator.
- Alert if SecureXL Fast Accelerator is on but there is no table.
- Alert if there is a Fast Accelerator table but it is off.
3. New Auto-Detect Elements for MDS
Monitor the CME process – Cloud Management Extension (CME) is a utility that runs on Check Point’s Multi-Domain Servers (MDS). This new ADE ensures that CME is always running.
Next Steps
If you are planning to upgrade to 7.10, we recommend that you also apply the latest OS security patches if you haven’t already done so. Run the Ubuntu “unattended-upgrade” utility to update the Ubuntu OS on the server to address the recent polkit vulnerability. Upgrades can be run at any time, using option (2) of imanage to load the latest security updates. If you have any questions about these exploits, need any additional help with mitigation, or have any general concerns, please don’t hesitate to contact us.
To see a complete list of features and bug fixes, refer to the release notes page on our website. As always, if you have questions or comments, we’re here to help.