Indeni 7.11 Uptime Report, Suppress Alerts, Grafana Dashboards & Automation
New Platform Capabilities
1 – Suppress Issues
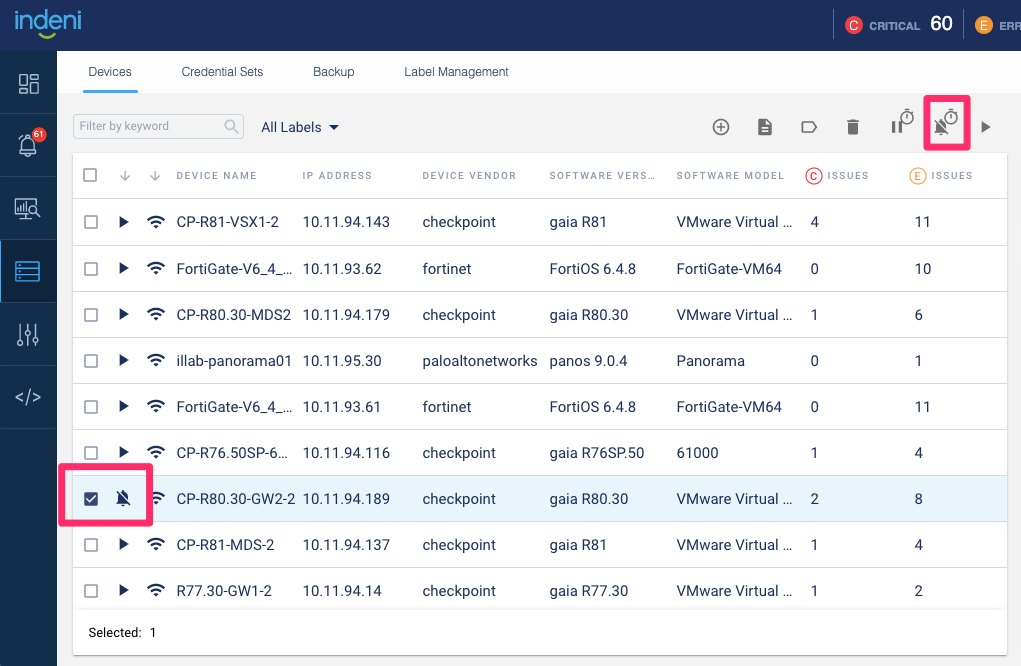
You may occasionally need to place your security device into maintenance mode. During maintenance, devices might be unavailable for short periods of time. To prevent alert messages such as “Failed to Communicate”, you can suspend automation of these devices. Suspending a device halts data collection and alerting. Instead, you want the Indeni platform to continuously collect the data you need without triggering any alerts. You can use the new “suppress issues” option instead of “suspend”. This new feature is just like the suspend feature, except that data collection continues during maintenance.
For more information about the configurations involved in these device maintenance mode options, please refer to the Indeni 7.0 User Guide – 5.4 Managing Devices.
2 – Uptime Report
The uptime report calculates the percentage of uptime over a specified interval. For instance, device A has 99% uptime over the last year. You can export the report in CSV format for further analysis or reporting.
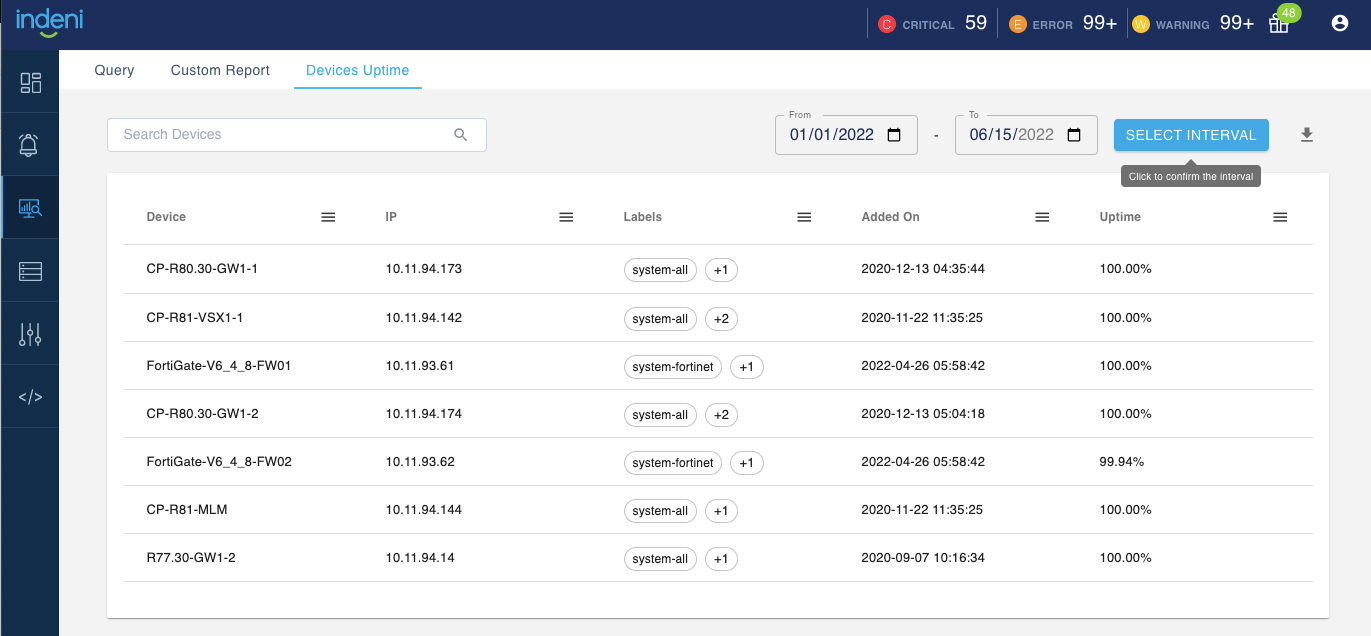
For more information about this new report, please refer to the Indeni 7.0 User Guide – 4.2 Device Uptime Report.
3 – Hostname for LDAP
Before 7.11, you configure the Active Directory URL with the IP address and the port. With 7.11, you can now use the hostname and the port.
4 – New Graph for Check Point Firewall Virtual memory usage
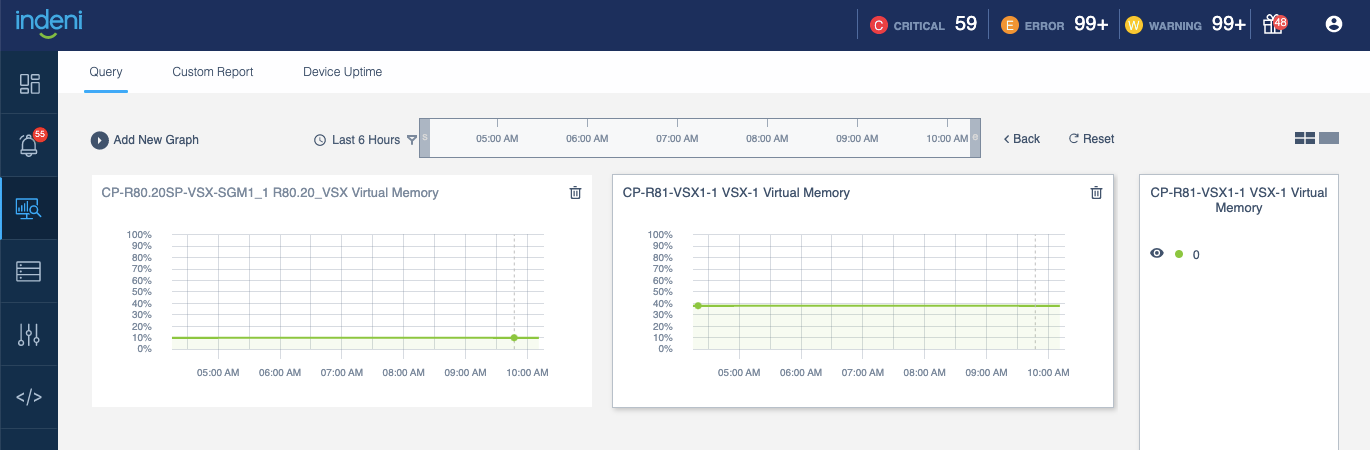
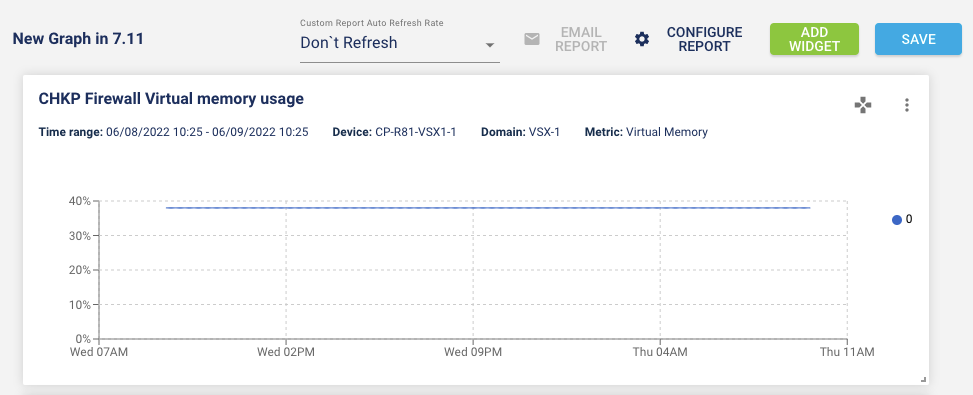
The graph is also available in the new Grafana VSX dashboard.
More Grafana Dashboards
We have heard some really positive feedback for the Grafana device dashboards released early this year. Thanks to your feedback and requests, we are releasing more device dashboards.
The configuration instruction for Grafana integration is available in Part 9: Grafana Dashboards. Check out the two new chapters:
- Naming convention for the dashboard JSON files
- Latest list of device dashboards
1 – Check Point
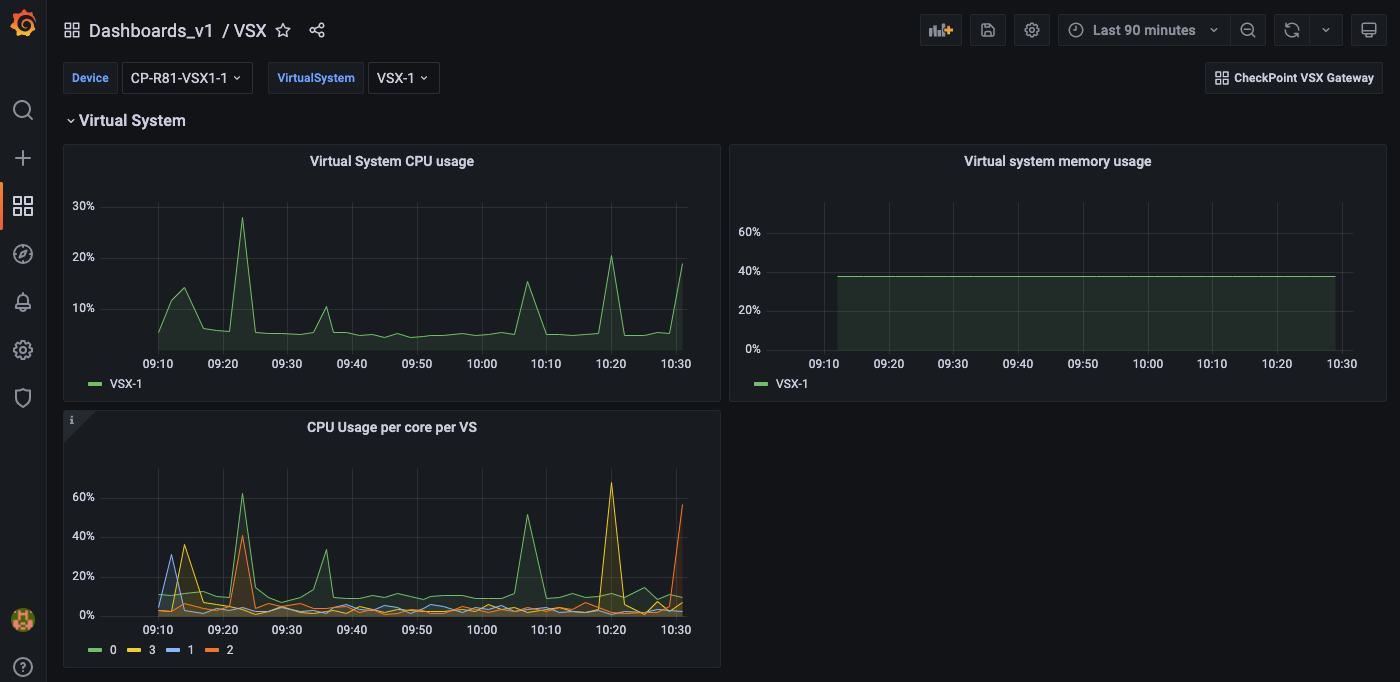
New Check Point VSX Gateways
There are two separate dashboards for the VSX gateway. The main dashboard consists of the global metrics that apply to all the virtual systems. You select the VSX from the main dashboard. The VSX dashboard has metrics pertaining to the individual virtual system. Remember to download both the VSX Gateway dashboard as well as the VSX sub dashboard for the virtual system.
JSON files to download from the checkpoint folder:
- CHKP-GW-VSX-R7-11.json (main dashboard)
- CHKP-GW-VSX-vs-R7-11.json (VSX sub dashboard)
Check Point VSX Gateway dashboard short video
New Check Point Management Server. JSON file to download:
- CHKP-MGMT-R7-11.json
Check Point Management Server dashboard short video
Updated Check Point Gateways Dashboard
Speaking of feedback, we are releasing a new Check Point version of the device dashboard to work with this new release. This includes adding tooltips to many of the panels. As new metrics are added or removed, we are updating the dashboard accordingly. That means a dashboard will always have a recommended Indeni release that it is intended to work with. This is also the reason of having a naming convention so you can associate the dashboard with the Indeni release.
JSON file to download:
- CHKP-GW-R7-11.json
There were some concerns around performance. Grafana is fetching a lot of data points from the Indeni server in real time so some panels can take a minute to load. To improve performance, we have a new layout where we break the dashboard into many sub dashboards. This layout significantly reduces the number of data points at any one time to improve the overall user experience. This is available for Fortinet FortiGate. Check out the video below and provide your feedback. We are considering switching to this layout.
2 – Fortinet
FortiGate Firewalls
The new FortiGate device dashboard has a main dashboard with many sub dashboards, grouped by capabilities. This dashboard is applicable to VDOM and non VDOM devices.
JSON files to download from sub folder FTNT-FW-R7-11:
- FTNT-FW-Main.json
- FTNT-FW-sub-HA.json
- FTNT-FW-sub-NetIntStats.json
- FTNT-FW-sub-NetIntStats-pl-error.json
- FTNT-FW-sub-Network.json
- FTNT-FW-sub-Network-pl-NetIntInfo.json
- FTNT-FW-sub-Services.json
- FTNT-FW-sub-SessionGlobal.json
- FTNT-FW-sub-SessionVdom.json
- FTNT-FW-sub-System.json
Watch this short video with the new layout and let us know what you think (product@indeni.com).
3 – Palo Alto Networks
New dashboard for Panorama. JSON file to download from the panw folder:
- PAN-Panorama.json
Panorama dashboard short video
Security Infrastructure Automation
1 – New Auto-Detect Elements for Fortinet FortiGate Firewalls
Virtual domains (VDOMs) are used to divide a FortiGate into two or more virtual units that function independently. We are excited to announce our full support for VDOMs in this release. We have also added many new alerts:
- IPS extended database package is not enabled
- FortiGate is in conserve mode
- DoS IPv4 is not configured
- Sessions clash
- Kernel sessions are deleted due to lack of memory
- Sessions have been removed
- High number of ephemeral sessions
- Software end of support nearing
- Hardware end of support nearing
2 – New metrics for Fortinet FortiGate
Many new metrics have been added for enhanced visibility. These metrics are also available using the Grafrana device dashboard. They are particularly useful for troubleshooting memory issues. The session statistics are also useful to identify DoS attacks.
- FortiGuard services last update
- Top 5 processes consuming the highest memory
- Top 5 processes with the most used socket memory
- Top 5 processes with the most active file descriptors
- Total number of current sessions
- Session setup rate per second
- Total number of sessions clash (cumulative)
- Number of sessions deleted because the system is running low memory
- Concurrent number of sessions in ephemeral state
- Current number of sessions in removable state
- Total number of sessions that have been removed because they have been flushed
- Total number of sessions that have been removed because interface went down
- Current number of TCP sessions in various states
3 – Auto-Detect Elements for Palo Alto Networks NGFW
- High Packet Descriptor (on-chip) usage
High on-chip descriptor usage can occur under various conditions causing slowness and packet loss. This new ADE will alert if the average packet descriptor on-chip utilization is above a user defined threshold.
- High Packet Descriptor (on-chip) maximum usage
Similarly, Indeni will alert if the packet descriptor on-chip maximum utilization is above a user defined threshold. If the device has multiple data plane elements, each will be inspected and alerted separately.
- Alert on packet buffer reaches maximum threshold
When a spike occurs, the average function calculated may not exceed the threshold to trigger an alert. This new alert generates an alert if a spike occurs regardless of the average.
- Alert on Policy Based Forwarding (PBF) rule inactive state
Policy based forwarding allows you to bypass the routing table, in favor of routing options defined by the PBF rule. This new alert will be generated if any of the PBF rules become inactive.
4 – New Auto-Detect Elements for Check Point Devices
- New SecureXL Fast Accelerator Alerts
- Fast Acceleration status mismatch across cluster members
- Fast Acceleration table mismatch across cluster members
- Fast Acceleration status mismatch across VS in cluster members
- Fast Acceleration table mismatch across VS in cluster members
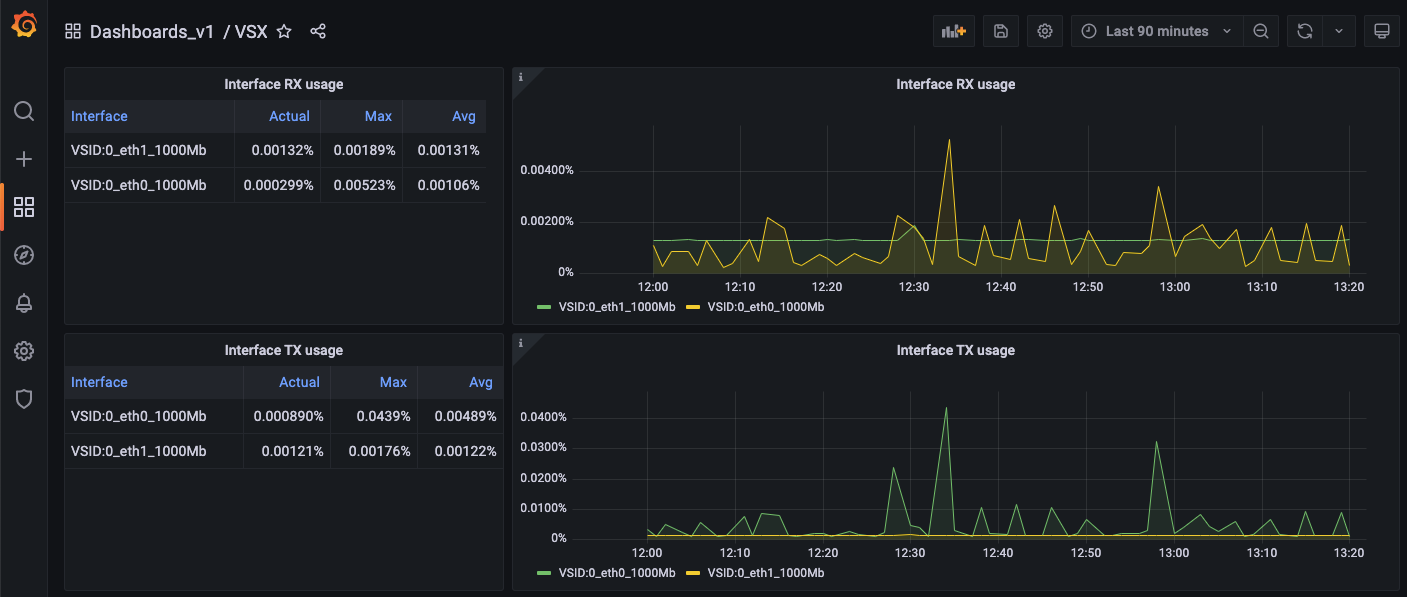
- Interface Rx/Tx Usage support for VSX
This is another example where new metrics are added to a release; new Grafana panels are possible. We are now able to show the link utilization specific to a virtual system.