Indeni 8.0 Zscaler App Connector & Network Security Automation
New Devices Support
1 – Zscaler App Connector
With a hybrid office environment going forward, you’re probably migrating from legacy VPN technologies to forward-looking Zero Trust Network Access (ZTNA) technologies. A cloud-delivered ZTNA solution enables a workforce from anywhere, using any devices and accessing any applications.
Zscaler Private Access (ZPA) is one of the popular ZTNA solutions in the market. With ZPA, users can access applications in the data center, public cloud and SaaS securely from anywhere.
ZPA sits between a user and an application. It inspects all traffic and controls, and which applications are available to the user. It does this regardless of whether or not the application is deployed behind corporate firewalls, deployed in a public cloud or deployed as a SaaS application.
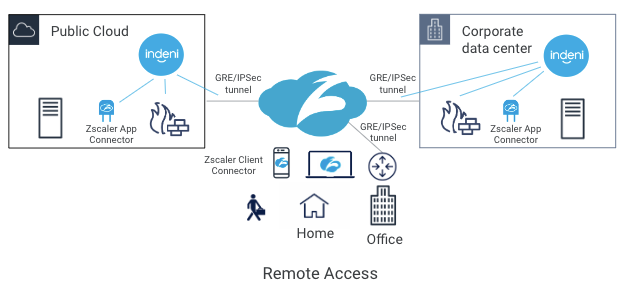
One of the key components of ZPA is Zscaler App Connector. It provides the secure authenticated interface between customer’s applications and the ZPA cloud. App Connectors are deployed in the public cloud and the corporate data center. To connect the data center and the ZPA cloud, customers typically establish either GRE or IPSec tunnels to connect the two locations. Today, Indeni can monitor GRE and IPSec tunnels. With the new Zscaler support, Indeni will also monitor Zscaler App Connector performance to give you additional insight. With a cloud-based service, the first thing you want to ensure is that the on-premise components are working as intended.
Key Capabilities
- Server availability and uptime alerting
- Alert when uptime is too low
- Alert when uptime is too high
- System-level performance metrics alerting
- CPU usage – Alert if utilization is above a certain user-defined threshold
Note: Due to RedHat Linux limitation, we can not do core-level CPU usage and we will track the overall CPU usage. This should not be a problem since ZScaler does not support any core-level optimization on Linux servers
- Memory consumption checks – Alert if memory utilization is above a certain user defined %
- Zombie processes – Alert if a high number of zombie processes are detected based on a user-defined threshold
- Disk fill check – Automatically discovers all connected disks and monitors their capacity and i-node usage. Alert if utilization is above a certain user-defined threshold
- Network checks (monitor bandwidth bottlenecks) – Alert if utilization is above a certain user-defined threshold
- Service level performance metrics and uptime alerting
- Ability to monitor the Zscaler App Connector process running on the VM
- Alert if a process under monitoring goes down
- Alert if a process under monitoring is restarted
- Alert if the ZScaler process’s resource usage exceeds defined thresholds
- Additional Monitoring
- Source port consumption – Continuously access the number of in-use ports against the available ports. Alert if the in-use ports are approaching the limit
- File descriptors exhaustion – If the number of file descriptors is not sufficient on the App Connector host, transactions can fail due to file descriptor exhaustion. Alert if the file descriptors are about to exhaust
2 – Check Point Quantum Lightspeed Firewalls
Check Point introduced their latest and fastest Quantum Lightspeed series of gateways early in the year. These appliances utilize ASIC technology to deliver high throughput and low latency. We’re excited to announce the release of Quantum Lightspeed support. Indeni automation platform delivers a level of proactiveness that easily prevents IT outages. You can now have the same ability to resolve Quantum Lightspeed issues before they arise.
Security Infrastructure Automation
1 – Check Point
1.1 New Auto-Detect Elements for Check Point Secure Gateways
- Alert on kernel packet drops
This alert is designed specifically to track specific application issues. It is disabled by default. Please contact product@indeni.com if you want to learn more about this alert
- VSX: Identify ARP table exhaustions
- Monitor NTPD as a critical process
- Logging servers configured do not match requirement
- Configured Web timeout too high
- Missing Web timeouts configuration
- Alert on microburst conditions
The CPU spike detective tool monitors the system CPU usage and checks for spikes. Taking advantage of this new tool, Indeni will alert using the algorithm described in sk166454
1.2 New Auto-Detect Elements for Check Point Maestro
- Track the CPU usage for each VSX instance on Maestro firewalls
- Alert on BGP peer down
- Alert if Multi-Queue is disabled
- Kernel packet drops
- Alert on microburst conditions
- Logging servers configured do not match requirement
- Missing Web access timeout configuration
- NTP service is down
1.3 Updates
- Disable the “kernel errors found in log files” alert by default
- Add a new tag for the CPU blade – this enables a user to select a device and the corresponding blade. This way, we limit the number of CPUs shown in a graph
- Change the severity for the “Configured SSH timeout too high” alert from Error to Warning
- Change the default global configuration for the “High CPU usage per core(s)” alert from 70% to 80%
2 – New Auto-Detect Element for Cisco ASA
- Hardware Element Down
3 – FortiGate NGFW
Fortinet has released security advisory FG-IR-22-398, warning that the heap-based buffer overflow vulnerability in FortiOS SSL-VPN has been actively exploited in attacks. The vulnerability is tracked as CVE-2022-42475. Fortinet advises customers to take immediate actions.
4 – Palo Alto Networks NGFW
4.1 New Auto-Detect Elements
- Monitoring GRE tunnels
Many customers use GRE tunnels to connect their sites to the ZPA cloud. This enhancement along with the Zscaler App Connector support provide much improved visibility
- Monitoring VM memory cap
Indeni currently tracks the nominal memory of PANW devices. However, on VMs the memory may be capped at a lower value. This led to the situation where VMs ran out of memory without the issue being detected. Checking if the memory is capped can avoid potential memory issues
- Monitor NTPD as a critical process
- Timezone configured does not match requirement
- Logging servers configured do not match requirement
- Configured Web timeout too high
- Missing Web timeouts configuration
- Alert on microburst conditions
Using a similar algorithm described above for Check Point devices, a similar alert is implemented for PANW devices. While we realize that PANW devices are different from Check Point devices, we don’t have the best practice guideline from Palo Alto Networks. We are using a similar logic as Check Point devices. I would be interested in your thoughts, please let me know product@indeni.com.
4.2 New Metrics
- Tracking IPv4 addresses for all the network interfaces. This information is included in the DEVICE INFO page
- New total throughput metric
4.3 Improvements
- Remediation steps
- Added new Knowledge articles to many alerts
- Improved step by step recommended remediations for many alerts
- Fixed broken links
- Rename rules to use generic names so alerts don’t appear to be related to Check Point devices
- Restrict INDs from running on small appliances (PA-2xx & PA-4xx)
- panos-anti-spyware-info-low-severity
- panos-captive-portal-tls-version
- panos-dns-sinkhole
- panos-edl-capacity
- panos-edl-connectivity
- panos-edl-list-empty
- panos-edl-stats
- panos-security-zone-any
- panos-show_system_logdb-quota
- panos-show-protocol-bgp-peer
- panos-show-running-global-ippool
- panos-show-system-setting-ssl-decrypt-memory-detail
- panos-show-vpn-flow
- Panos-vulnerability-info-low-severity
- Change the severity for the “Configured SSH timeout too high” alert from Error to Warning
5 – Blue Coat ProxySG Improvements
- Change the severity for the “Configured SSH timeout too high” alert from Error to Warning
- Change the severity for the “Configured Web Management (GUI) timeout is too high” alert from Error to Warning
New Platform Capabilities
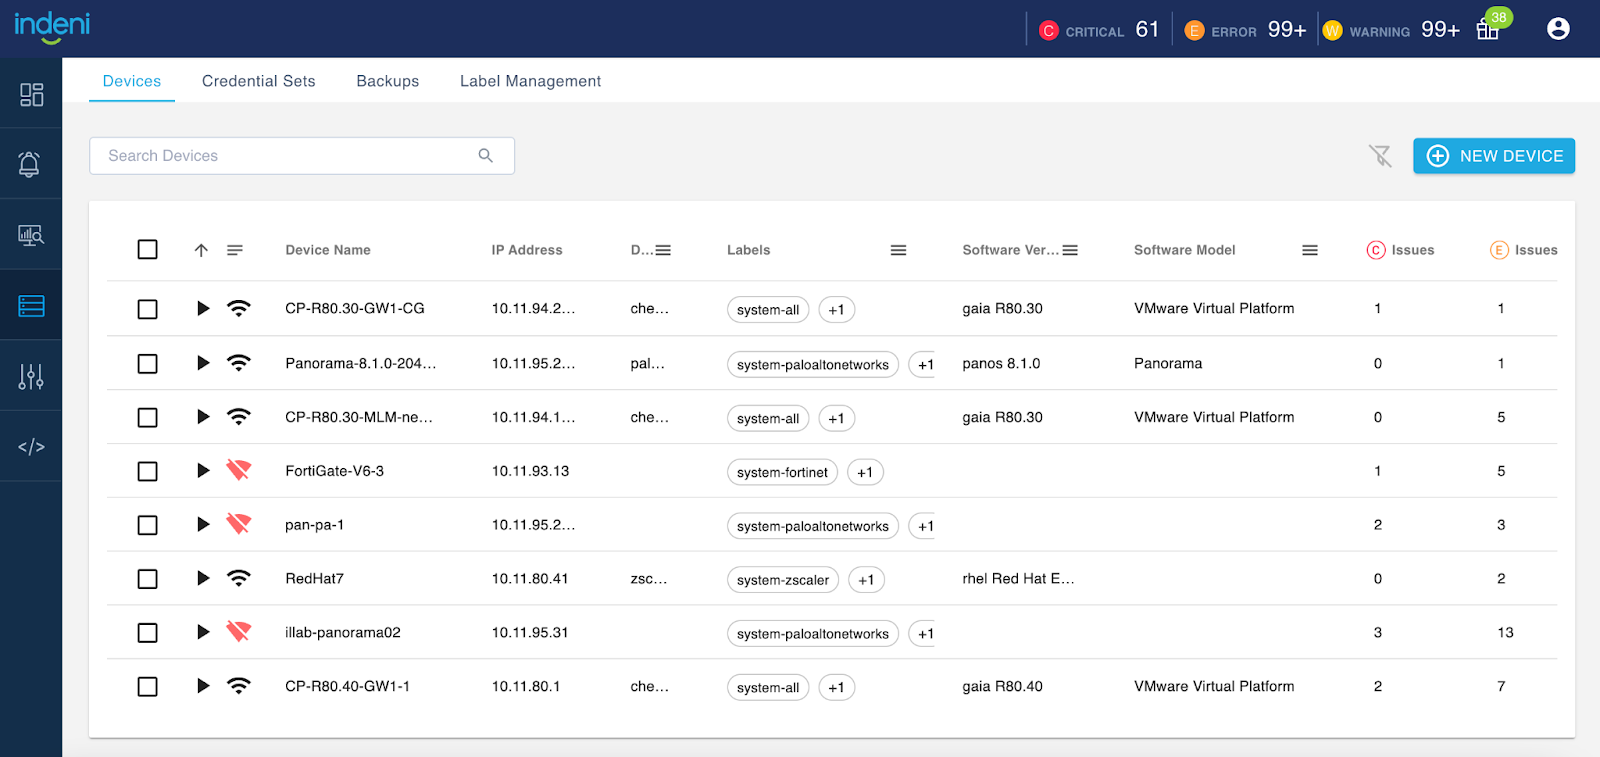
1 – The Devices Page has a fresh look
You can filter by Device Vendors, Labels, Software Version and Software Model. You can resize the columns. Beyond just a new look and feel, you can also export device information in CSV or XLS format by right-clicking any row.
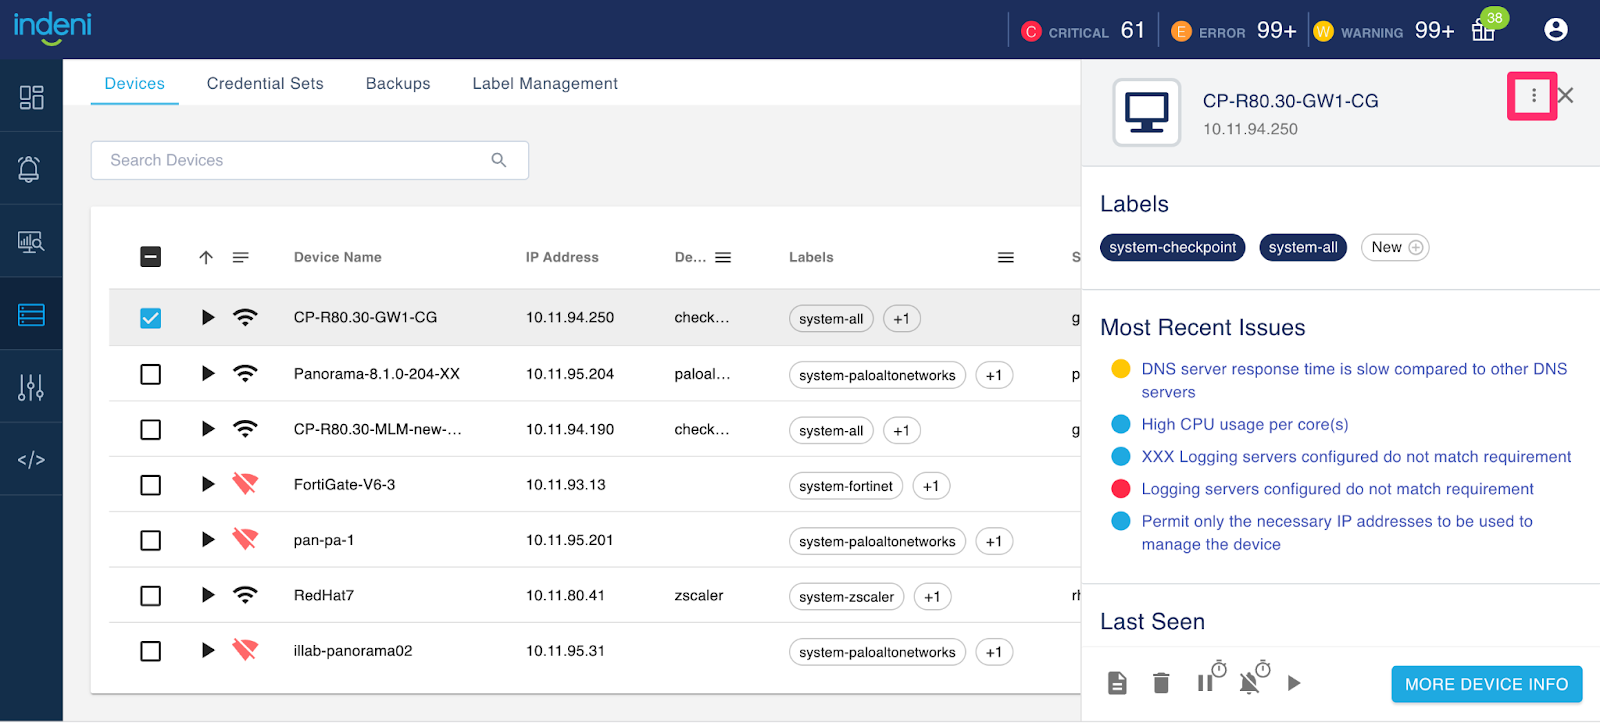
2 – Rename a Device
Don’t worry about a typo, you can easily fix it with this new feature. Select the device you want to rename from the Devices tab. This will bring up a drawer on the right. Click on the 3 dots icon, select Edit Device and provide the new name for the device. The new name will be reflected immediately across the system, there is no need to do anything else.
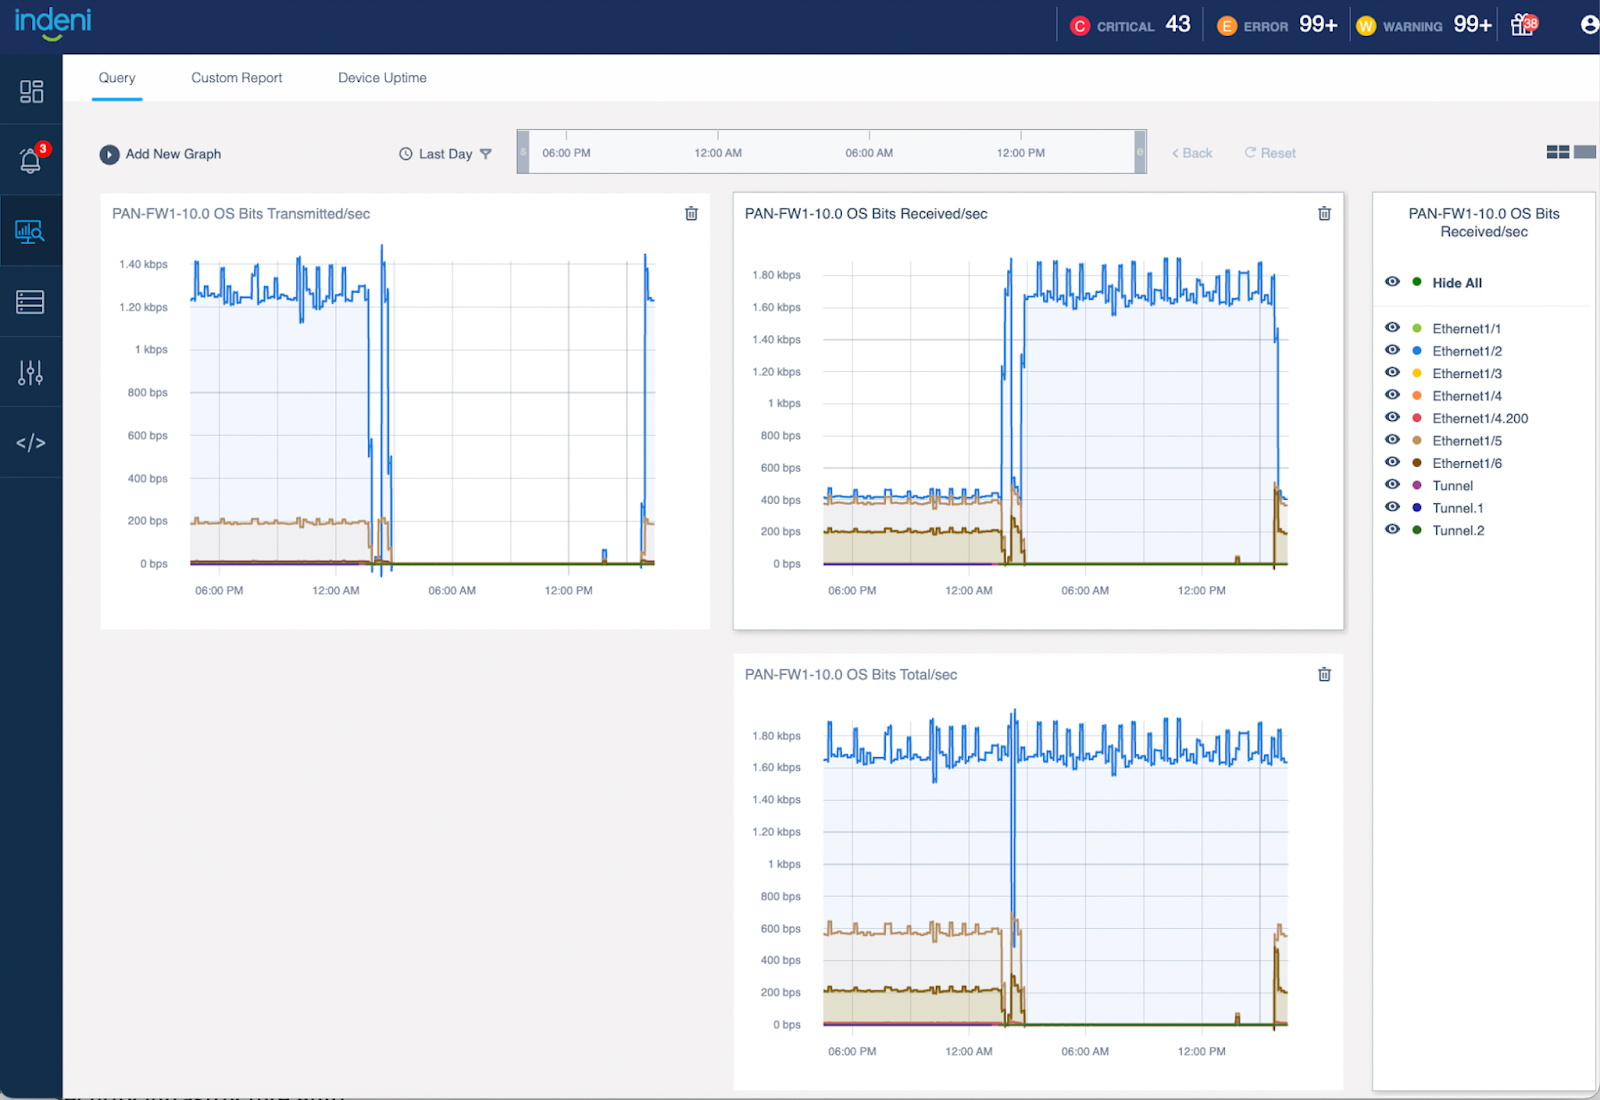
3 – New Graph for Palo Alto Networks NGFW to track the total throughput
We’ve graphs showing the network throughput in bits per second (bps), one for the amount of data transmitted and the other for the amount of data received. The new graph shows the combined network throughput.
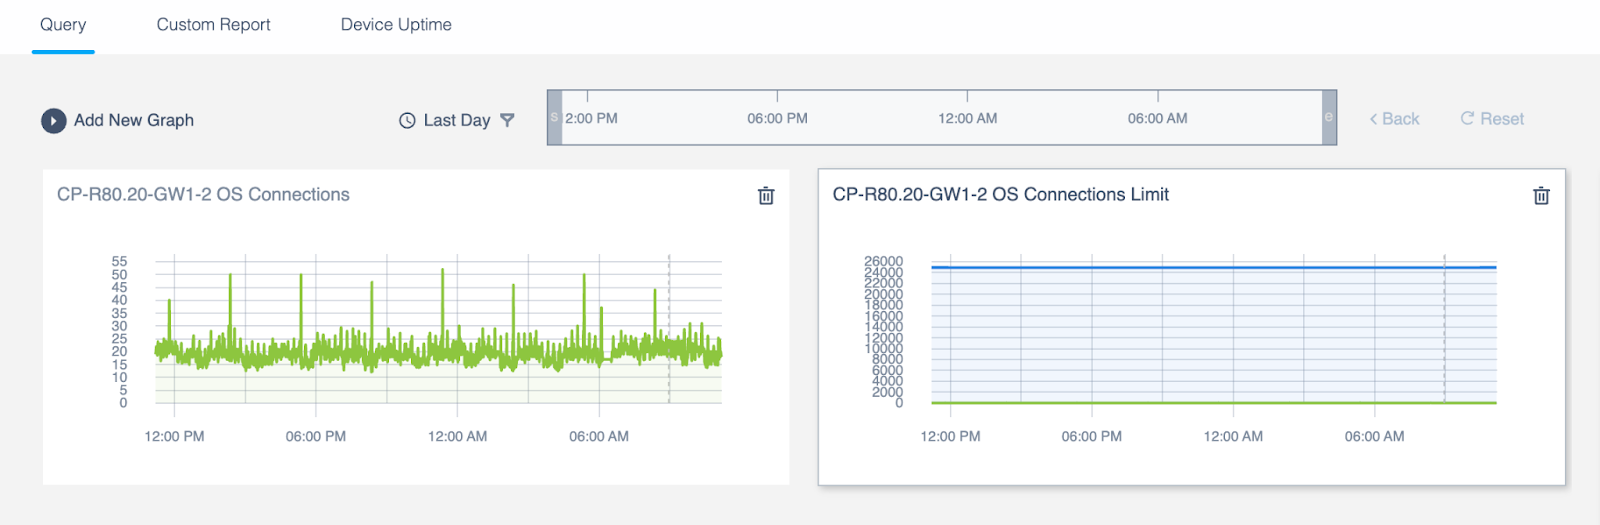
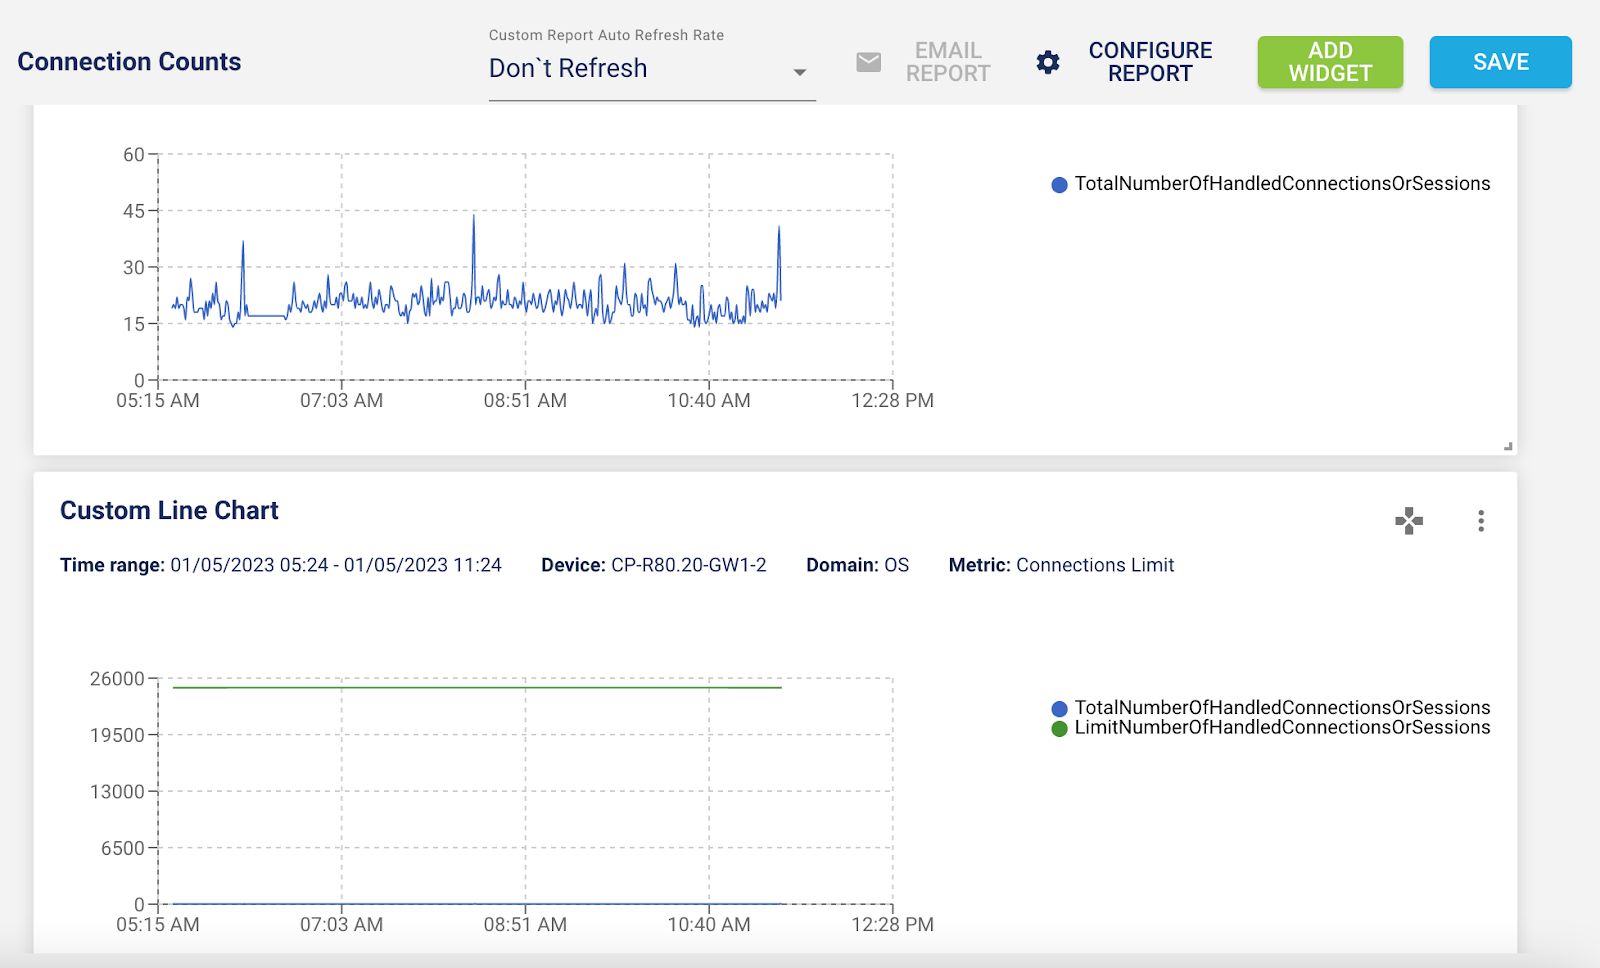
4 – New Connections Count Graph that doesn’t show the limit
While it is useful to show the connection count limit, if the concurrent connection counts have much lower values than the limit, the connection count is indistinguishable.
5 – Grafana Dashboard for Zscaler App Connector
With the new Grafana dashboard, you can see the 70+ metrics about App Connector at a glance.
Watch a short video here
The instructions to import the new Zscaler App Connector dashboard can be found here.
6 – Server Components Update
Upgrade major components to newer software version:
- PostgreSQL 14
- MongoDB 4.4
- Python 3.0
- Node.js 16.17.1
With these updates, we strongly recommend that you take a snapshot of your VM before you upgrade. If you have any questions relating to the upgrade, please contact support@indeni.com, we would be happy to assist you.