Indeni 8.3 Deeper insight into your security infrastructure with analytics dashboard
Analytics dashboard
The reason we started our analytics dashboard journey early in the year was because we had learned so much from performing technical analysis of your alert export data. We were able to help you make more informed decisions based on data. In some environments, we identified problematic devices, as well as common top alerts. We successfully helped you optimize your environment and identify new projects. Thank you for your overwhelmingly positive feedback, we appreciate it.
The exercise with alert export data analysis led to the development of many new widgets and improvements to existing widgets. We’re on the last leg of our analytics dashboard journey. In 8.3 we made every widget interactive and added a new ‘Top 10 Alerts’ widget. With these enhancements, you will be able to perform a similar technical analysis using the analytics dashboard.
Watch this short video for an overview on how you can leverage the new widgets to quickly process the information about potential problems in your environment.
Top 10 Alerts
Identifying top alerts in your environment helps you quickly understand the most common issues in your environment. It also helps you identify areas for optimization, such as tuning the thresholds for your alerts. This is one of the key areas we focused on in the alert export technical analysis. Now you can prioritize your troubleshooting effort based on severity and frequency of the issues.
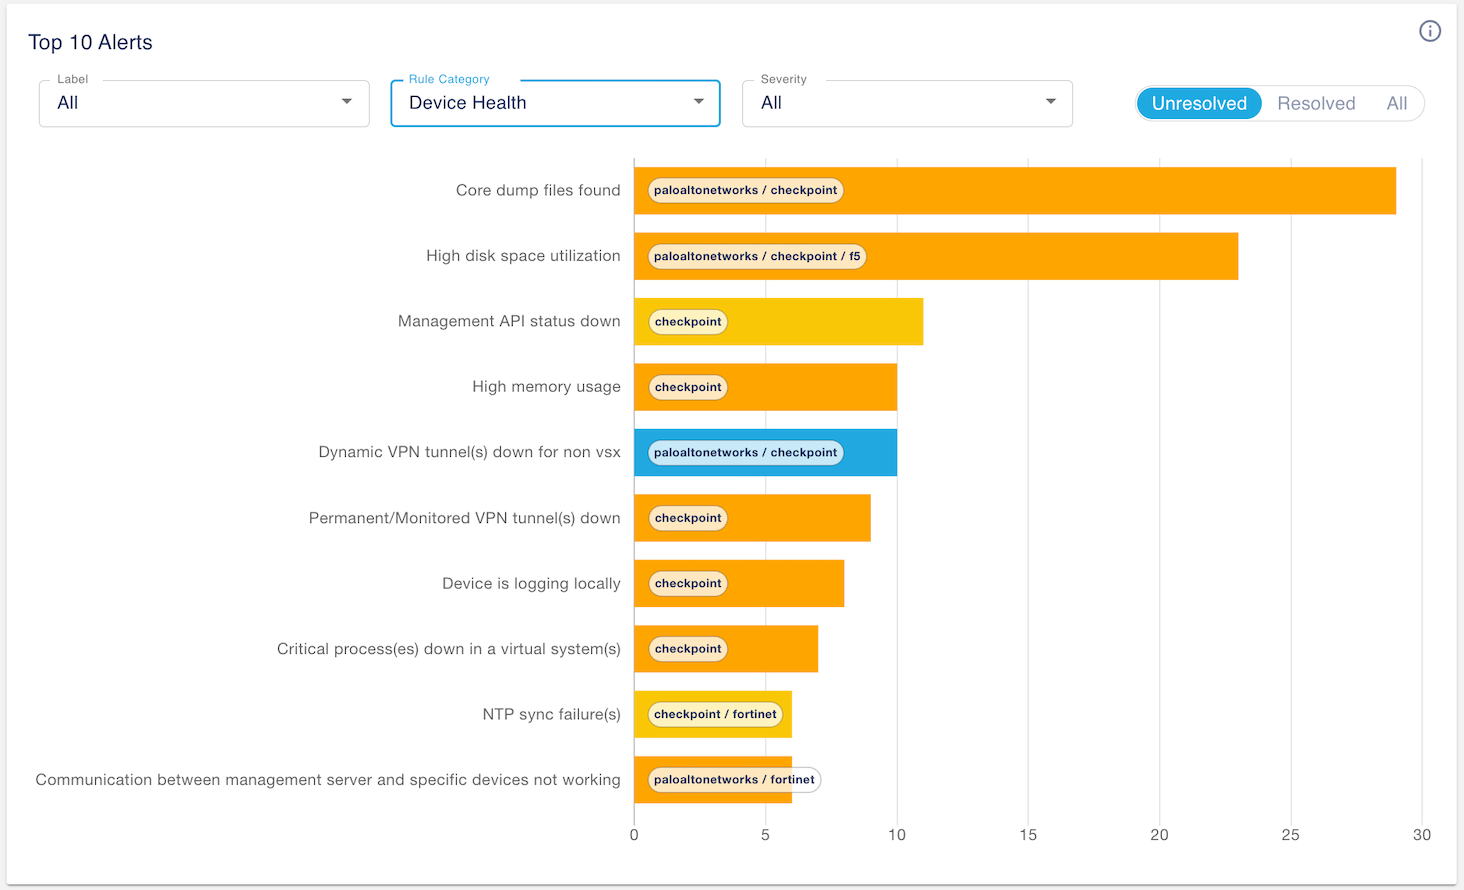
In this example, you want to identify the most common device health issues across your environment. Setting the categories to device health, you can see that you have many core dump files found for your Palo Alto Networks and Check Point firewalls.
The chart is highly interactive. It is designed to let you ask questions and interact with data to gain deeper insight into your infrastructure. You can narrow your analysis by using labels (default is system-all) to limit the data to a subset of devices. You can filter by severity and you can also factor unresolved issues (default), resolved issues or both. Drill down to explore further by clicking any bars in the chart.
Other usability enhancements
- When you put a device in maintenance mode, you have an option to suppress alerts while metrics collection continues. The system will automatically resume alerts generation after the specified duration. In this release, you can use the resume icon to un-suppress issues before reaching the specified time.
- On a MAC machine, you can now use the BACK button to go back and forth between the dashboard and the issue page.
Network Security Automation
1 – BlueCat Integrity
- High service CPU usage detection
- DNS lookup failure(s) – Test the DNS service amongst DNS servers to ensure the servers are healthy
- Large accumulated WAL file size or large number of accumulated WAL files (BAM only)
- Automatically troubleshoot a ‘NTP sync failure’ problem to identify the root cause
- Communication amongst DNS servers not working – A DNS service disruption is often caused by the network. For example, a firewall policy change causing communication issues between the primary DNS and the secondary DNS server, potentially leading to zone transfer failure. By proactively verifying the ports and protocols are working between the servers, an outage can be prevented
- DHCP statistics for graphing and reporting
2 – Broadcom Blue Coat ProxySG
- Alert if the device stops sending syslogs to Syslog server
3 – Check Point Secure Gateways
- Generic Data Center Objects external server not reachable – You can enforce access to and from IP addresses defined in files located in external web servers. The system alerts if a secure gateway cannot access the external server for its policies
- Admin login table for locked objects – Performing tag revision can cause locked objects eventually causing a firewall failure. Although hotfixes are available to address the locked objects issue (see sk169772 from the Check Point Support portal), the system will verify if hotfixes have been applied. If not, the system will identify if locked objects are found
- Monitor contract file size – Contract file is an encrypted text file that contains a list of service contracts. Large cp.contract files can cause device instability. File size in excess of 1.5MB is considered too large. The system alerts when a large file size is detected. You can change the file size threshold
- Monitor log rate per Multi-Customer Log Manager – The system will alert you when the log rate is more than x% greater than the Indexer Rate. The default is set to 10%. You can change the default threshold
- Identity Collector – Trackiing when an ID Collector is no longer sending updates
4 – Palo Alto Networks NGFW
- Dynamic Address Group tags approaching limit – While high end devices can support over 100k tags, low end devices can only support 1000. When devices are maxing out their capacity, the registration process stops working. This alert allows you to define a threshold when tags are reaching a certain % of the maximum capacity based on the device model
- Common vulnerabilities and exposures
- CVE-2023-6790 PAN-OS: DOM-Based Cross-Site Scripting (XSS) Vulnerability in the Web Interface
- CVE-2023-6792 PAN-OS: OS Command Injection Vulnerability in the XML API