Network Automation for Check Point and Palo Alto Networks NGFW with Indeni 7.12
Network Automation Elements
New Auto-Detect Elements for Check Point Firewalls
- SNMP community string does not match requirement
- Management servers configured do not match requirement
- Timezone configured does not match requirement
- Ensure CPU core load-balancing for VSX firewalls (based on sk169352)
- Track log rate and alert if it approaches the platform limit
- RBA (Role-based administration) errors detected – if a device is running without user RBA definition, running CLISH commands will lead to CLINFR errors, e.g.:
- CLINFR0599 Failed to build ACLs
- CLINFR0819 User: Indeni denied access via CLI
- CLINFO0829 Unable to get user permissions
- Identity Server disconnected
- Identity Collector events received = 0
Other Enhancements related to Check Point Firewalls
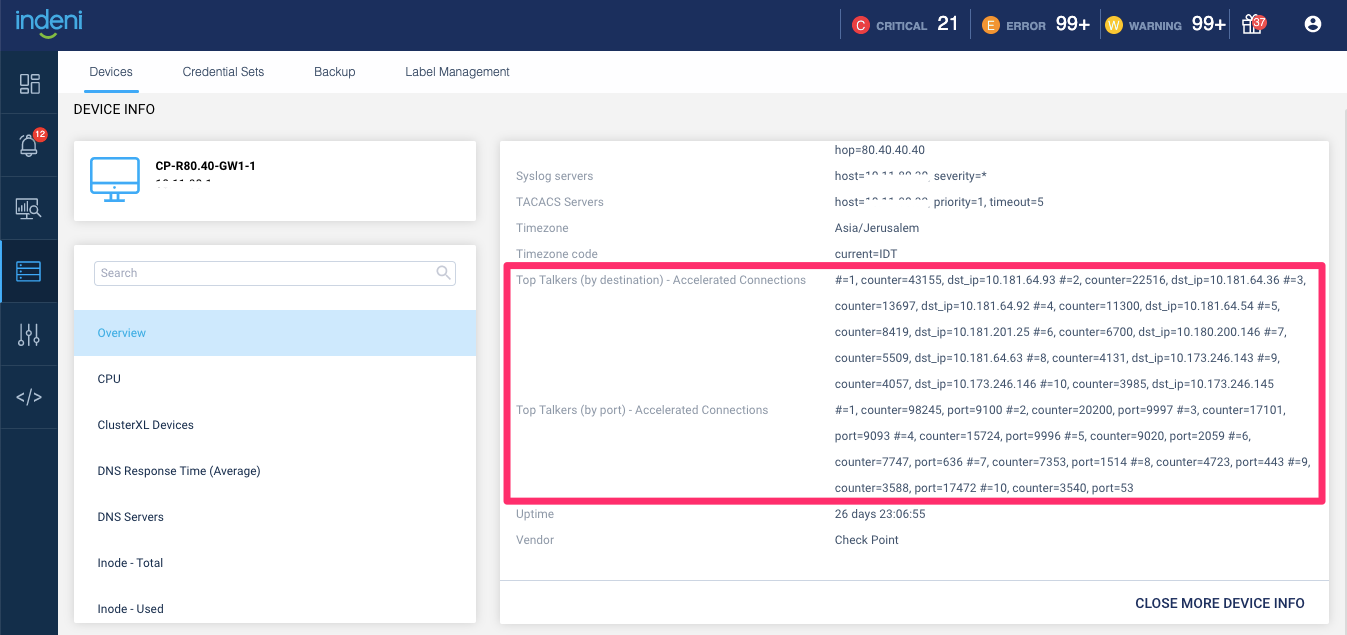
- High CPU usage ATE enhancement – If high CPU usage is detected, and that CPU core is associated with a single VS or a single interface, identify traffic directed to that CPU core causing high utilization. The ATE will execute packet capture and extract top talkers
- Added metrics to display:
- Top 10 connections and counts from Sources
- Top 10 connections and counts top to Destinations
- Top 10 Destination Ports along with the connection counts
Palo Alto Networks NGFW
- SNMP community string does not match requirement
- SNMP trap receiver servers configured do not match requirement
- Management servers configured do not match requirement
- Added CRITICAL & HIGH severity CVE alerts found in 2022
- CVE-2022-0030 PAN-OS: Authentication Bypass in Web Interface (Severity: HIGH)
- CVE-2022-0028 PAN-OS: Reflected Amplification Denial-of-Service (DoS) Vulnerability in URL Filtering
- CVE-2022-0024 PAN-OS: Improper Neutralization Vulnerability Leads to Unintended Program Execution During Configuration Commit
- CVE-2022-0778 Impact of the OpenSSL Infinite Loop Vulnerability CVE-2022-0778
- CVE-2021-44228 Impact of Log4j Vulnerabilities CVE-2021-44228, CVE-2021-45046, CVE-2021-45105, and CVE-2021-44832
- CVE-2021-3064 PAN-OS: Memory Corruption Vulnerability in GlobalProtect Portal and Gateway Interfaces
- Changed the severity to INFO for MEDIUM & LOW severity CVE alerts
- Changed the severity to INFO for CVE alerts impacting 7.0.0 or earlier
Fortinet FortiGate NGFW
- FortiOS/FortiProxyCritical authentication bypass on administrative interface (critical severity CVE-2022-40684). To learn more about this vulnerability, read this great blog by Fortinet.
License Enforcement
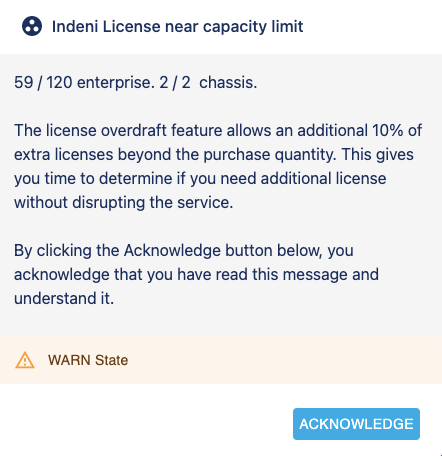
With licensing, you don’t want to be out-of-compliance for any extended period of time. Although we have warnings to notify you when you’re approaching your license limit, these warnings often go unnoticed. We are introducing license enforcement with a license overdraft feature. This feature allows an additional 10% of extra licenses beyond the purchase quantity to prevent service disruption. Once the count is over the 10% allowance, the system will stop functioning. As you approach your license limits, warning alerts are generated. A pop-up window will be displayed upon user logging in to the system to notify you of the overage. Users are requested to acknowledge the message. Upon acknowledging users are no longer bugged with the pop-up. We recommend reviewing your license counts and how they are consumed when the warnings begin. For more information, refer to the Indeni 7.0 User Guide – About License Enforcement.
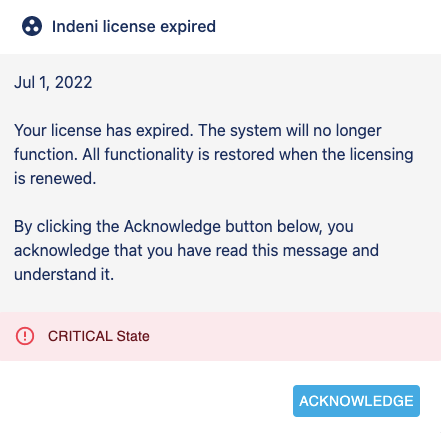
If the license count is over the 10% additional allowance, or the license has expired, the system will generate a critical error message and will no longer function. Every time a user attempts to login, a pop-up window will show the user the critical state.
Composite Grafana Dashboards
Responses to our Grafana project have been very positive. Thank you so much for taking the time to provide invaluable feedback. We’re truly grateful to have you as our customers!
With Grafana, our focus has been building device level dashboards for in-depth visibility thus far. With 7.12, we are introducing a new type of dashboard – composite dashboard. These dashboards provide a summary of multiple devices and vendors. Use them to pinpoint a particular device for further analysis. Unlike the device level dashboards, you will need to upgrade the Indeni server to v7.12 in order to take full advantage of these dashboards. We’ve made enhancements to our API to support these dashboards.
Composite dashboards:
- Multivendor Composite Main Dashboard
Start with this main dashboard, both for single and multi-vendor environments. It consists of a high level summary of what you’re automating:
- Summary of all the devices
- States of these devices – what devices are suspended, list of devices with critical alerts
- Number of clusters and their states
- Services and their states
From this dashboard, you can navigate to other sub-dashboards.
- Multivendor Composite by Label Sub dashboard
Labels are a way to group your devices making it easier to manage them. In this sub-dashboard, you select the label of interest. You can see, for example, the various states of the devices in a particular location.
- Multivendor Composite by Vendor Sub dashboard
In this sub-dashboard, you select the system labels for the vendor of interest. It makes it easy to see what device models and OS versions these devices are running along with their states. Even with a single vendor environment, you’ll find this sub-dashboard informative.
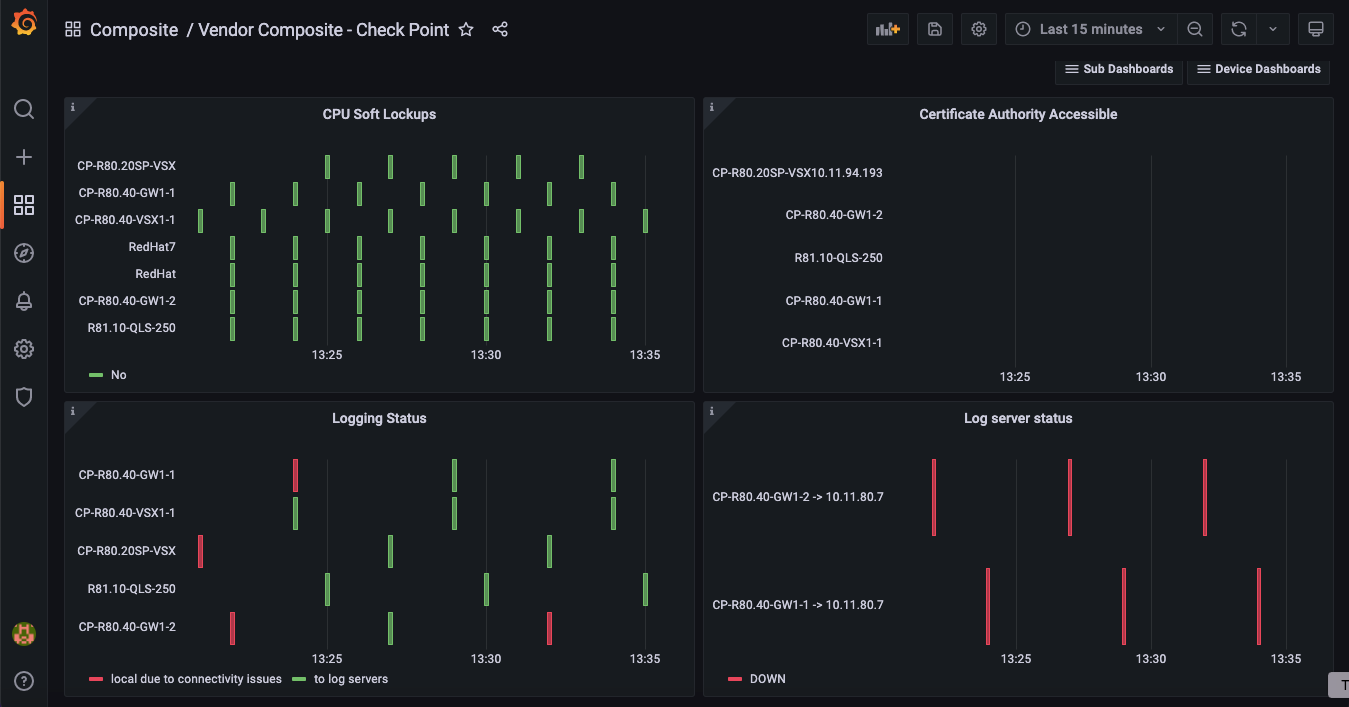
- Vendor Composite – Check Point Sub dashboard
Each vendor has its own unique metrics. This is where you will see information such as log server status.
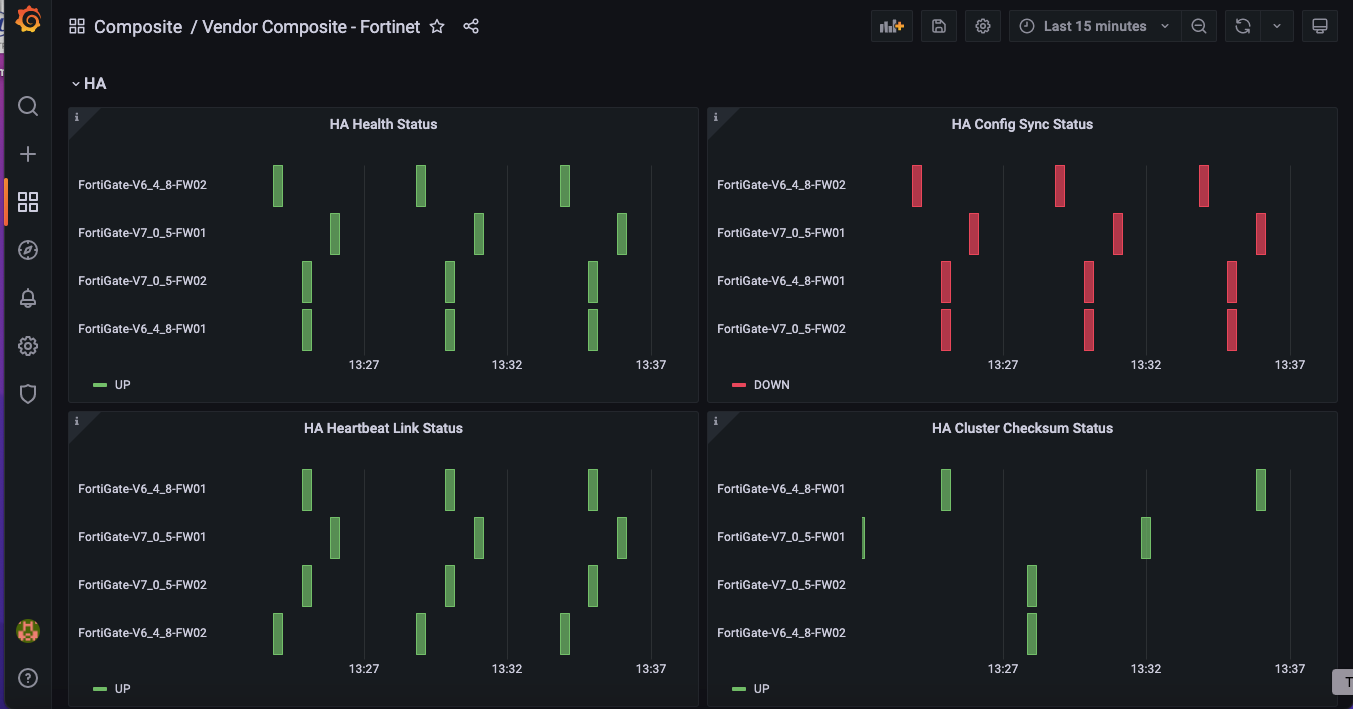
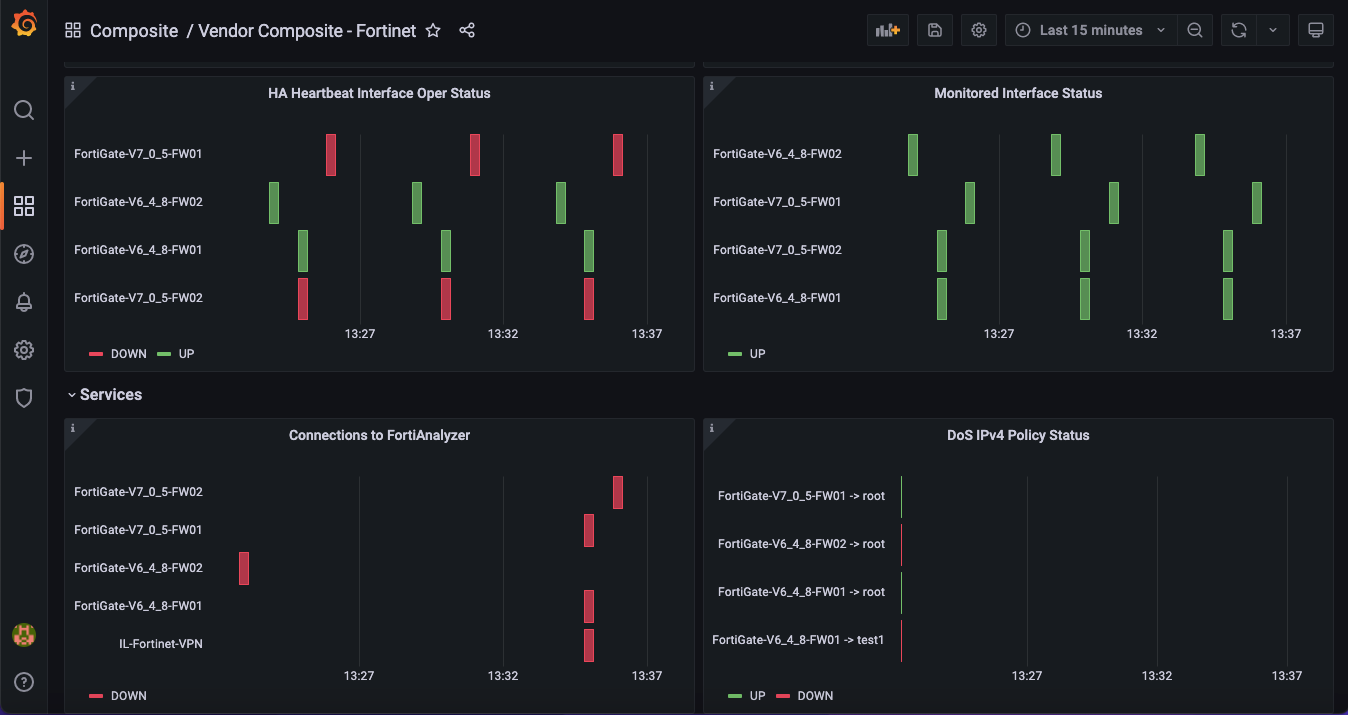
- Vendor Composite – Fortinet Sub-dashboard
FortiGate High Availability has some unique metrics. This sub-dashboard shows HA metrics unique to FortiGate clusters as well as unique metrics related to FortiGate.
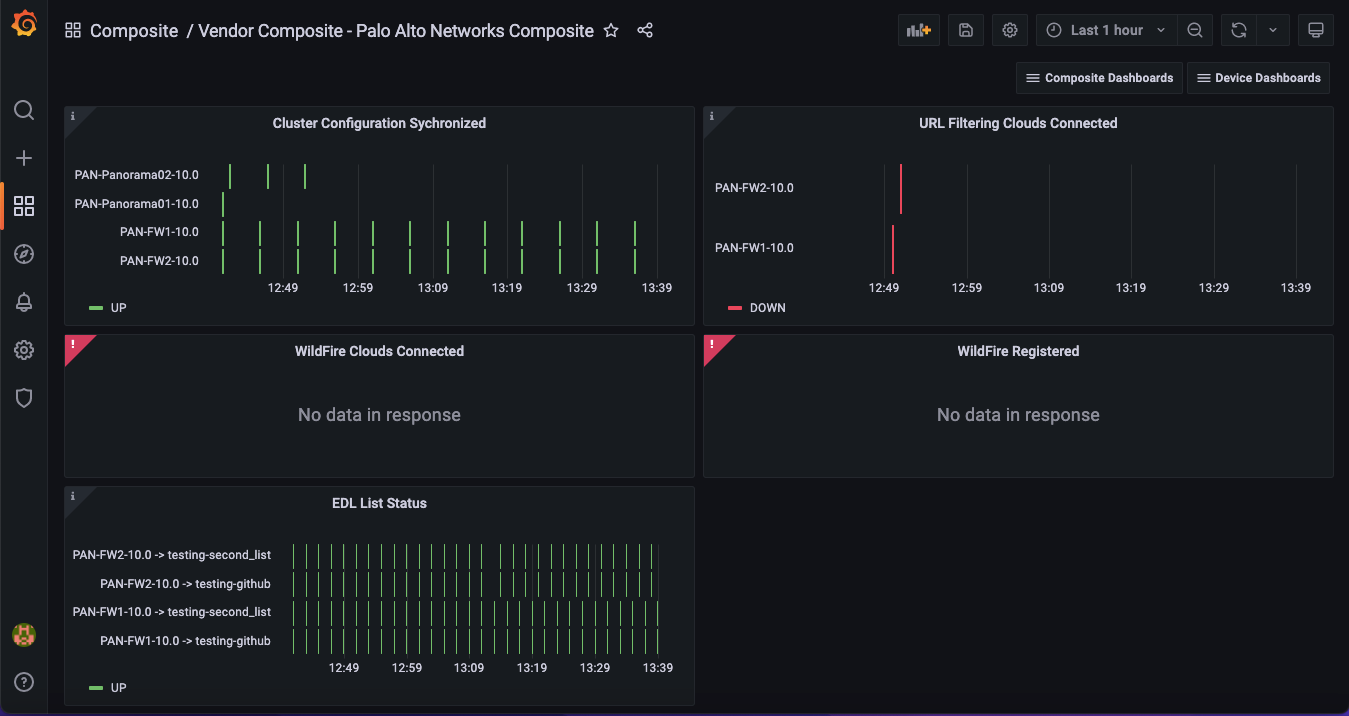
- Vendor Composite – Palo Alto Networks NGFW Sub dashboard
This is where you will find metrics related to WildFire, URL filtering, etc.
Device Compliance Dashboard for Palo Alto Networks NGFW
Consider this dashboard as a reference implementation. We want to release this dashboard to solicit feedback on what you would like to see for the compliance dashboard. Many security controls can be added based on your organization requirements. Ideally, we want your auditors to have access to these dashboards. We think this can be a powerful tool for you to engage with your auditors, but we would love to hear your thoughts. Send your thoughts to product@indeni.com, or reach out to your account manager. We would love to hear from you.
The configuration instruction for Grafana integration is available in Part 9: Grafana Dashboards. You’re welcome to download the new dashboards from our repository.