3.1 Dashboard
The Indeni dashboard allows you to quickly gain insight into your device estate’s high-level status.
The dashboard contains several widgets, each providing unique insight into different aspects of devices’ health and function.
Watch this video to get a high level overview of Indeni analytics dashboard.
Note: In 8.2, the Active Issues by Severity widget has been retired. The widget is being replaced by the Issues per Vendor widget.
Issues per Vendor shows the distribution of issues by severity for each vendor. It also shows the total number of issues as found by Indeni aggregated for each device vendor.

Click on any part of the bars to explore issues of the selected severity pertaining to the vendor. You can set filters based on Label (default system-all), rule category (default all rule categories) or severity. Use the toggle to select unresolved issues, resolved issues, or both (default unresolved).
Note: In 8.2, you can use Command-click on a Mac machine to start a new tab on your browser for drill down. Instead of clicking on the widget, use Command-click. This allows you to keep the filters on your dashboard intact and use the new tab to drill down on issues.
Note: In 8.3, you can use the browser back button to go back and forth between the Dashboard and the Issues page.
Devices Connection Status shows the total number of devices added into the system, giving a quick and clear indication of device monitored/automated by the system along with their statuses.

Click on any part of the pie chart to explore devices of the selected status in the device page. Set the label filter to show a subset of the devices.
Device Health by Vendor shows the overall health score of each vendor.
Healthy devices appear in green, while devices with critical health-related issues appear in red.
A device which is impacted by health issues is considered healthy if it has less than one critical health issue. The score is then aggregated for each vendor

In this example, 18 out of the 29 Check Point Secure Gateways have more than 1 critical issue. Similarly, 2 out of 3 FortiGate NGFW have more than 1 critical issue. Use the Label filter to show a subset of the devices.
Issues At-A-Glance shows the overall issues organized by Rule Category. Use this widget to help you quickly process information about the type of problems you’re experiencing in your environment and drill down to explore data.
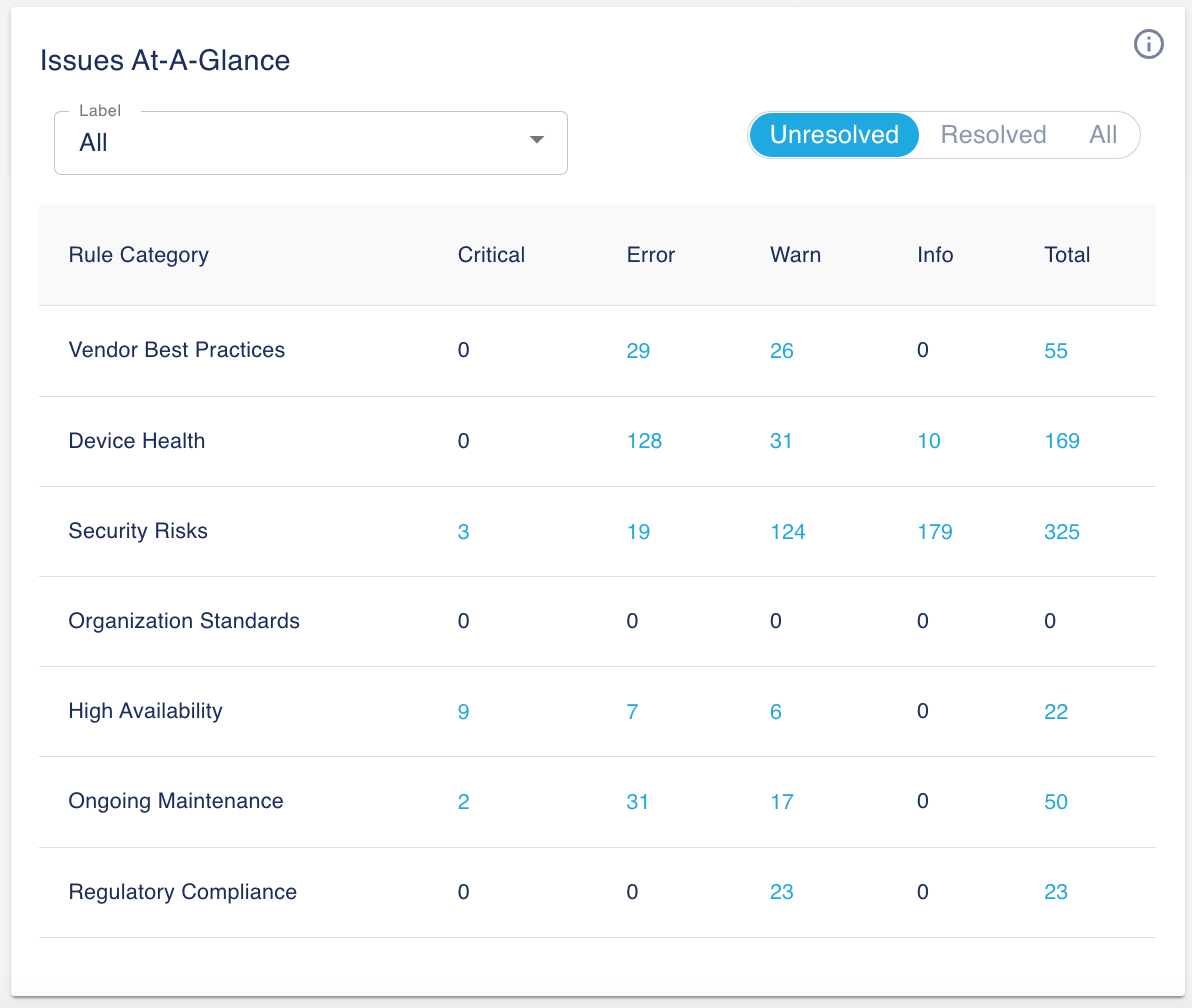
Drill Down to Explore
Click on any cell of the table to explore issues of the selected label, status, Rule Category and severity in the issues page.

Note the 3 filters applied to Status, Rule Category & Severity.
Top 10 Devices with the Highest # of Issues shows the breakdown of issues by severity. Use this widget to identify if you have problematic devices and drill down to explore data.

Use Label to filter the issues by severity for a vendor or a group of devices. The default label is system-all. Use the toggle to select unresolved issues, resolved issues, or both. The default toggle is set to unresolved issues. Filter out issues by severity. For example, you can deselect Warnings and Info from the list of issues.
Drill Down to Explore
Click on any part of the heatmap to explore issues of the selected label, status and severity in the issues page.

Note the 2 filters applied to Device & Status.
How to identify Problematic Devices

Use the 3 widgets attached to the heatmap. The first box shows the average # of issues per device per day. If the median # of issues is significantly less than the average #, it is indicative of problematic devices in your environment. The 3rd widget shows the % of total issues generated by the top 10 devices. A high percentage is indicative of problematic devices.
If you have less than 10 devices in your environment, it will always show as 100%.
When you set filters in the heatmap, the 3 widgets attached to the heatmap is recalculated to reflect the filters.
Please Note: Prior to 8.2, the dashboard factors all devices in the Indeni system including suspended devices. However, for devices that have been suspended for an extended period of time, the vendor of these devices can become unknown. This is the reason why you may see discrepancies in the total number of issues per vendor and the total number of issues in the ‘Active Issues by Severity’ widget.
In 8.2, the dashboard will only factor devices that are being actively monitored.
Active Issues Over the Past Week
The total number of active issues per each day is shown alongside the number of newly opened issues and newly resolved issues on that day. Use this chart to keep track of issues’ creation and resolution time. Hover over any point in the chart to see the number of active issues, as well as the number of issues created and resolved each day.

Note: In 8.2, you can set severity as a filter.
Issues Resolved by Day of Week
The total number of issues resolved per each day is shown alongside the total number of active issues on that day.

BlueCat Infrastructure Assurance Server

Used Storage Space shows the total storage space used on the Indeni server
CPU Utilization shows the current level of the Indeni server’s CPU utilization
Memory Utilization shows the current level of Indeni sever’s memory utilization