9.2 Importing Dashboards
Device Dashboards
Grafana is a great way to visualize hundreds of unique device metrics. The device dashboard is for those who want deeper visibility to a firewall. Using these dashboards, you can stay on track of the health and performance of devices in the last 90 minutes. To get started, use our sample device dashboards. They can be found on Bitbucket.
Dashboards are exported in Grafana JSON format, and contain everything you need (layout, variables, styles, data sources, queries, etc) to import the dashboard into your environment.
Please Note: Do not set the current time range to more than 90 minutes.
Importing A Sample Dashboard
Navigate to + on the left pane, Create > Import. Upload the json file from our Bitbucket repository. During importing, you can provide a dashboard name and folder. You will also be asked to map the data sources to your environment. If you used our data source names above, you can simply search for the same name.
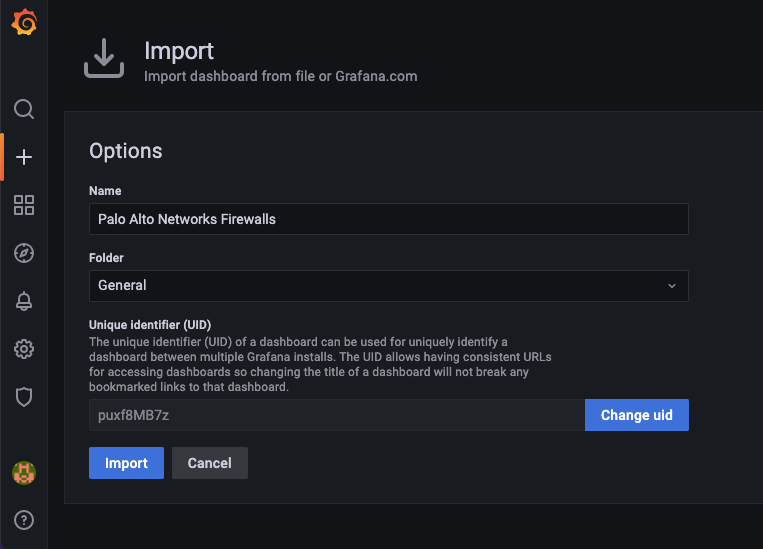
Click the Change uid button and blank out the field so a new uid will be created for your environment.
